|

Silver Price Analysis: XAG/USD climbs above $23.50 amidst dovish Fed remarks, falling US bond yields

  • XAG/USD ascends past the 100-day EMA, powered by dovish remarks from Fed officials and reduced US Treasury yields.
  • The technical outlook indicates potential resistance at 20-day and 50-day EMA, respectively, and support at 100-day and 200-day EMAs
  • Further upside is expected based on the RSI and 3-period RoC, although key pivot points and daily highs need to be breached for significant gain.

Silver price climbs past the 100-day Exponential Moving Average (EMA) and trades back above the $23.50 area, sponsored by several factors. Firstly, US Federal Reserve (Fed) Vice-Chairman nominee Philip Jefferson delivered dovish remarks alongside Philadelphia Fed’s Patrick Harker, while confidence about passing the US debt-ceiling bill triggered a fall in US Treasury bond yields.

XAG/USD Price Analysis: Technical outlook

From a daily chart perspective, XAG/USD is neutral to upward biased, capped on the upside by the confluence of two daily EMAs: the 20-day at $23.80 and the 50-day at $23.93. Upside risks lie above those levels, exposing the $24.00 figure. Conversely, XAG/USD sellers claiming the 100-day EMA at $23.46 could threaten to challenge the 200-day EMA at $22.84 for the third time.

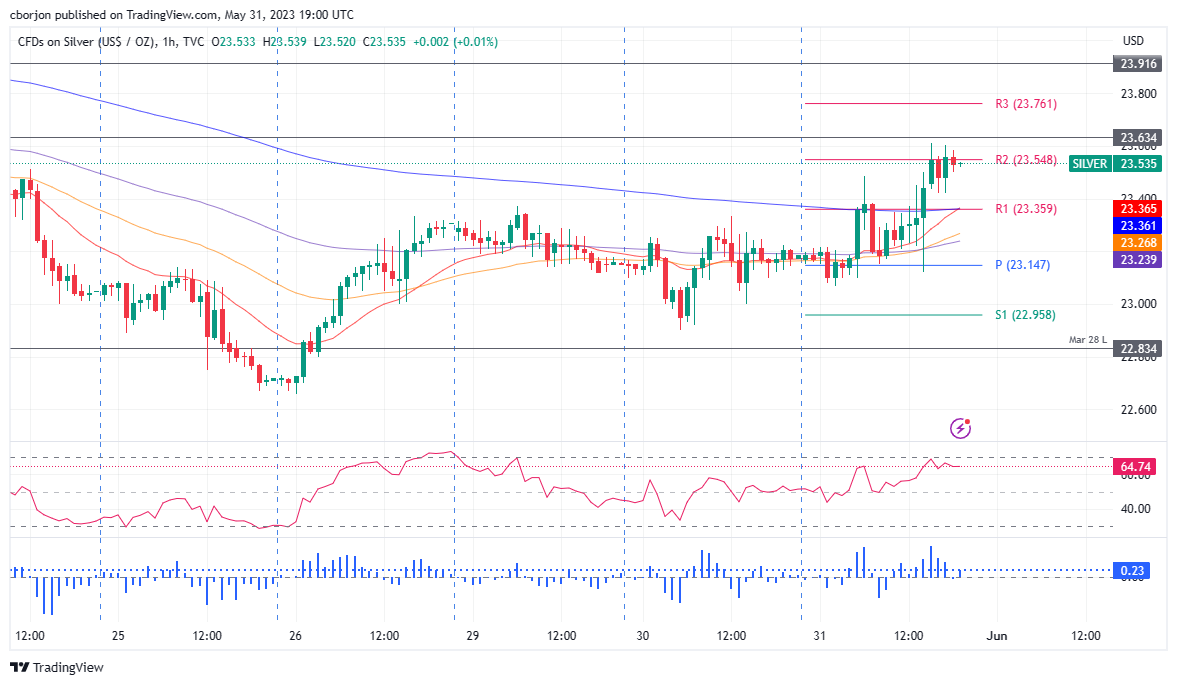
The XAG/USD hourly chart indicates the white metal is upward biased but facing solid resistance at the R2 pivot point at 23.54, with upside risks at the May 23 daily high of 23.63. A breach of the latter, XAG/USD could climb toward the May 22 high of $23.91. Conversely, the XAG/USD first support would be the R1 daily pivot at $23.36 before slumping toward the central pivot at $23.14. Once cleared, the daily low of $23.07 would be up for grabs, ahead of falling to the S1 pivot point at $22.96.

Of note, oscillators like the Relative Strength Index (RSI) indicator suggest further upside expected alongside the 3-period Rate of Change (RoC).

XAG/USD Price Action – Hourly chart

XAG/USD Hourly chart

XAG/USD

Overview
Today last price23.57
Today Daily Change0.38
Today Daily Change %1.64
Today daily open23.19
 
Trends
Daily SMA2024.18
Daily SMA5024.4
Daily SMA10023.35
Daily SMA20022.06
 
Levels
Previous Daily High23.34
Previous Daily Low22.93
Previous Weekly High23.92
Previous Weekly Low22.68
Previous Monthly High26.09
Previous Monthly Low23.57
Daily Fibonacci 38.2%23.19
Daily Fibonacci 61.8%23.09
Daily Pivot Point S122.97
Daily Pivot Point S222.74
Daily Pivot Point S322.55
Daily Pivot Point R123.38
Daily Pivot Point R223.57
Daily Pivot Point R323.8

Author

Christian Borjon Valencia

Christian Borjon began his career as a retail trader in 2010, mainly focused on technical analysis and strategies around it. He started as a swing trader, as he used to work in another industry unrelated to the financial markets.

More from Christian Borjon Valencia
Share:

Markets move fast. We move first.

Orange Juice Newsletter brings you expert driven insights - not headlines. Every day on your inbox.

By subscribing you agree to our Terms and conditions.

Editor's Picks

EUR/USD meets some support near 1.1670

EUR/USD further extends its bearish leg on Wednesday, coming under extra pressure and breaching below the 1.1700 level to flirt with four-week troughs in a context of marginal gains in the US Dollar ahead of the key US NFP on Friday.

GBP/USD consolidates above mid-1.3400s; bullish potential seems intact

The GBP/USD pair is seen consolidating its heavy losses registered over the past two days and oscillating in a narrow trading band, just above mid-1.3400s during the Asian session on Thursday. However, the fundamental backdrop warrants some caution for bearish traders and before positioning for an extension of the retracement slide from the 1.3565-1.3570 region, or the highest level since September 18, touched on Tuesday.

Gold declines to near $4,450 as safe-haven demand eases

Gold price declines to near $4,450 during the early Asian trading hours on Thursday. The precious metal loses momentum as traders book profits after a recent rally. Later on Thursday, the weekly US Initial Jobless Claims data will be released. The attention will shift to the US December employment report on Friday. 

XRP faces selling pressure as key on-chain metric resets and ETF inflows weaken

Ripple (XRP) is trading downward but holding support at $2.22 at the time of writing on Wednesday, as fear spreads across the cryptocurrency market, reversing gains made from the start of the year.

2026 economic outlook: Clear skies but don’t unfasten your seatbelts yet

Most years fade into the background as soon as a new one starts. Not 2025: a year of epochal shifts, in which the macroeconomy was the dog that did not bark. What to expect in 2026? The shocks of 2025 will not be undone, but neither will they be repeated.

XRP battles selling pressure as profit-taking, ETF inflows shape outlook

Ripple (XRP) is trading downward but holding support at $2.22 at the time of writing on Wednesday, as fear spreads across the cryptocurrency market, reversing gains made from the start of the year.