Silver Price Analysis: XAG/USD trims its losses but remains exposed to sellers below the 200-DMA
- Silver price stopped its fall but remains shy of reclaiming the 200-EMA.
- A third daily close below the 200-day EMA will cement Sllver's price downward bias.
- Silver Price Analysis: Break below $21.40 would expose the $21.00 mark.

Silver price attempts to recover the 200-day Exponential Moving Average (EMA) but stays shy of reclaiming the $21.94 price level, which would underpin the XAG/USD towards the psychological $22.00 mark. Nevertheless, the Silver price registers gains, and the XAG/USD is trading at $21.71 after hitting a daily low of $21.44.
Once the XAG/USD extended its losses beyond the 200-day EMA, sellers faced difficulties dragging prices below the weekly low of $21.43. The Relative Strength Index (RSI) is in bearish territory but turned flat, meaning bears are getting a respite before re-attempting to drive prices toward the November 28 low at $20.87.
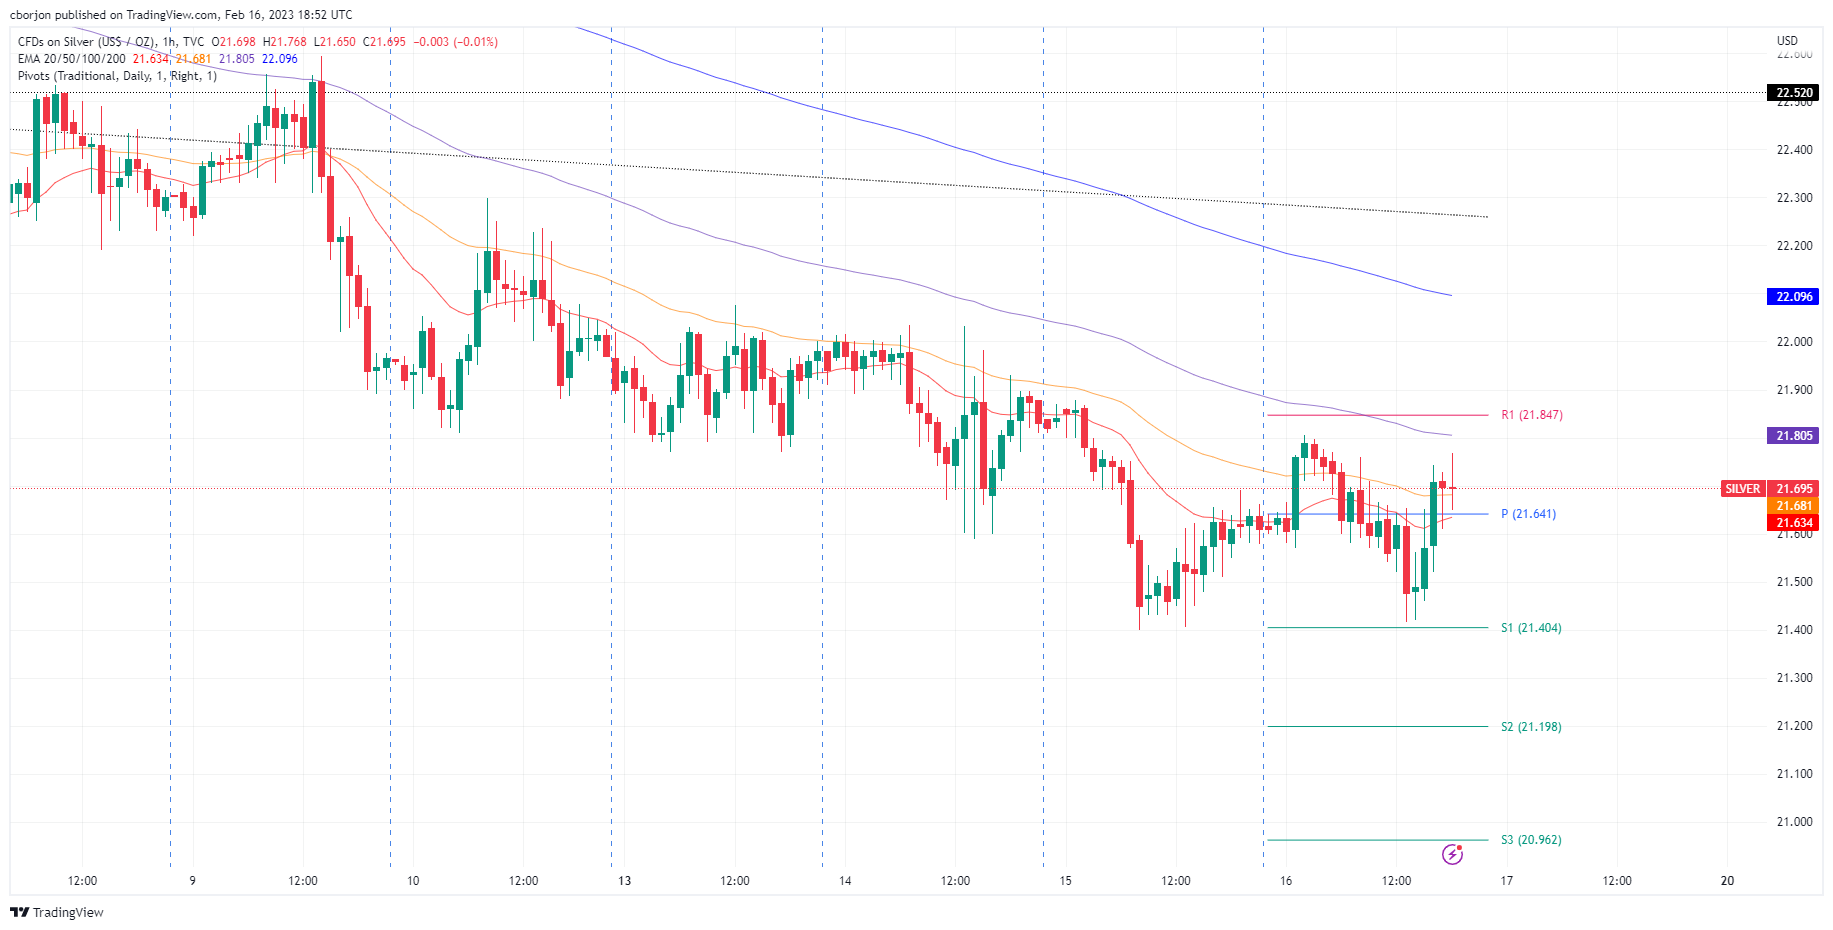
In the short term, the XAG/USD 1-hour chart suggests the pair is sideways. Even though the white metal dived towards the S1 daily pivot at $21.40, it encountered bids and climbed back above the daily pivot at $21.64. However, failure to crack the R1 daily pivot at $21.84 would keep the daily chart bias intact.
That said, the XAG/USD first support would be the daily pivot at $21.64, followed by the S1 pivot point at 21.40. A breach of the latter and the following line of defense for Silver bulls would be the S2 daily pivot at $21.19, followed by the S2 area at $20.96.
XAG/USD 1-Hour chat
XAG/USD Key technical levels
Author

Christian Borjon Valencia
FXStreet
Markets analyst, news editor, and trading instructor with over 14 years of experience across FX, commodities, US equity indices, and global macro markets.

















