|

Silver Price Analysis: XAG/USD trapped within EMAs as US bond yields climb

  • Rising US bond yields curtail Silver’s momentum as it moves between key daily Exponential Moving Averages.
  • XAG/USD breaking resistance at around $23.88 may propel Silver to challenge $24.00.
  • A drop below the 100-day EMA and the June 5 low of $23.25 could trigger a steeper decline.

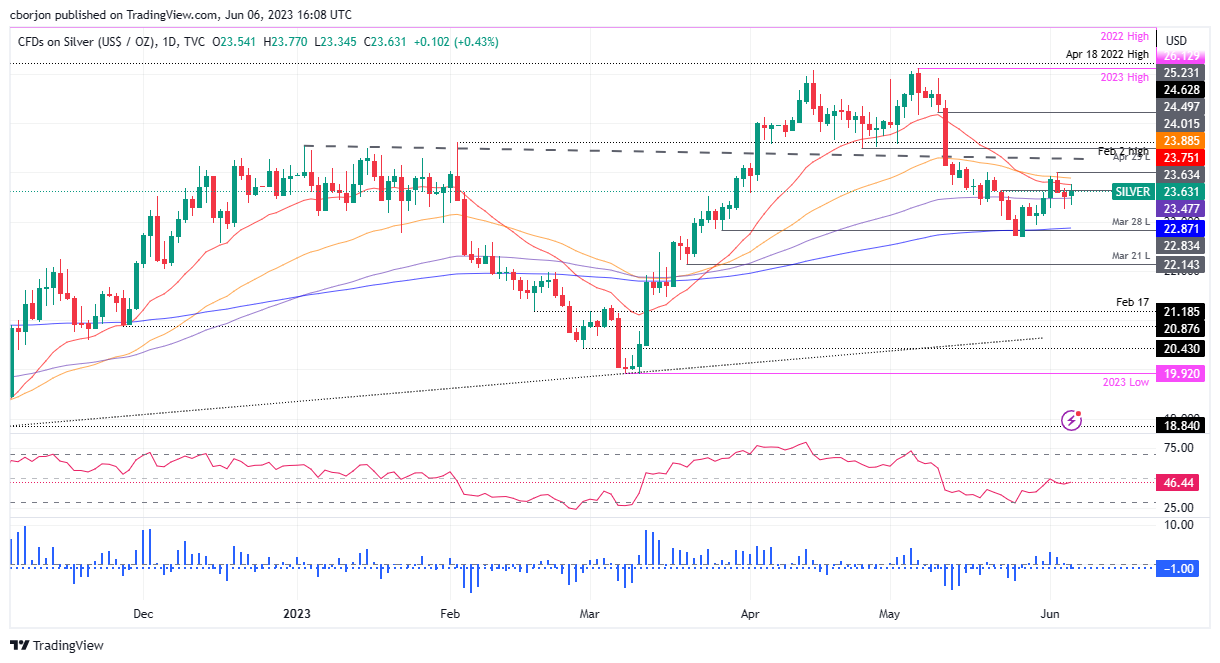
Silver price stopped its fall amidst rising US Treasury bond yields, cushioned by the 100-day Exponential Moving Average (EMA) lying at $23.47. Still, it also failed to rally, capped by solid resistance at around the $23.74-88 area, where the 20 and 50-day EMAs lie. Therefore, XAG/USD is trading at $23.52, almost flat.

Must read: Gold Price Forecast: XAU/USD steadily around $1960s amid higher US bond yields

XAG/USD Price Analysis: Technical outlook

From a daily chart perspective, the XAG/USD path remains unclear, trapped between daily EMAs, pending cracking resistance at around $23.74-88, which would pave the way to challenge the June 2 high of $24.01. A breach of the latter would shift Silver upwards and open the door to test the April 25 low turned resistance at $24.49 before aiming towards February 2 high at $24.63.

Conversely, XAG/USD falling below the 100-day EMA and sliding beneath the June 5 low of $23.25 could exacerbate a more profound fall toward the May 30 daily low of $22.93. Once broken, the XAG/USD next challenge will be the 200-day EMA at $22.87

The Relative Strength Index (RSI) indicator is in bearish territory, while the 3-day Rate of Change (RoC) followed suit. Therefore, in the near term, Silver’s path could be downwards.

XAG/USD Price Action – Daily chart

XAG/USD Daily chart

XAG/USD

Overview
Today last price23.56
Today Daily Change-0.01
Today Daily Change %-0.04
Today daily open23.57
 
Trends
Daily SMA2023.76
Daily SMA5024.46
Daily SMA10023.35
Daily SMA20022.15
 
Levels
Previous Daily High23.69
Previous Daily Low23.25
Previous Weekly High24.02
Previous Weekly Low22.93
Previous Monthly High26.14
Previous Monthly Low22.68
Daily Fibonacci 38.2%23.42
Daily Fibonacci 61.8%23.52
Daily Pivot Point S123.32
Daily Pivot Point S223.06
Daily Pivot Point S322.88
Daily Pivot Point R123.76
Daily Pivot Point R223.94
Daily Pivot Point R324.2

Author

Christian Borjon Valencia

Christian Borjon began his career as a retail trader in 2010, mainly focused on technical analysis and strategies around it. He started as a swing trader, as he used to work in another industry unrelated to the financial markets.

More from Christian Borjon Valencia
Share:

Markets move fast. We move first.

Orange Juice Newsletter brings you expert driven insights - not headlines. Every day on your inbox.

By subscribing you agree to our Terms and conditions.

Editor's Picks

EUR/USD steadies near 1.1750 ahead of final Eurozone CPI amid fading USD recovery

The EUR/USD pair steadies around the 1.1750 area during the Asian session on Wednesday, and for now, seems to have stalled the previous day's sharp retracement slide from the highest level since September 24. Meanwhile, the fundamental backdrop remains tilted in favor of bullish traders and suggests that the path of least resistance for spot prices remains to the upside.

GBP/USD gains ground above 1.3400 on UK PMI optimism

The GBP/USD pair gains momentum to around 1.3425 during the early Asian session on Wednesday. The Pound Sterling edges higher against the Greenback on the upbeat UK preliminary S&P Global Purchasing Managers' Index data. Traders will take more cues from the Fedspeak later on Wednesday. 

Gold advances to near seven-week highs amid US labor market cooling

Gold price extends its upside to near seven-week highs above $4,300 during the Asian trading hours on Wednesday. The precious metal gains momentum as the US labor market remains relatively resilient but shows signs of slowing. The mixed US employment report for November reinforces bets of further rate cuts by the US Federal Reserve and weighs on the US Dollar.

XRP dips as bearish pressure persists despite ETF growth

Ripple is finding footing above $1.90 at the time of writing on Tuesday after a bearish wave swept across the broader cryptocurrency market, building on persistent negative sentiment.

Ukraine-Russia in the spotlight once again

Since the start of the week, gold’s price has moved lower, but has yet to erase the gains made last week. In today’s report we intend to focus on the newest round of peace talks between Russia and Ukraine, whilst noting the release of the US Employment data later on day and end our report with an update in regards to the tensions brewing in Venezuela.

BNB Price Forecast: BNB slips below $855 as bearish on-chain signals and momentum indicators turn negative

BNB, formerly known as Binance Coin, continues to trade down around $855 at the time of writing on Tuesday, after a slight decline the previous day. Bearish sentiment further strengthens as BNB’s on-chain and derivatives data show rising retail activity.