|

Silver Price Analysis: XAG/USD trades with modest losses around $25.00, downside seems limited

  • Silver drifts lower on the last day of the week, though lacks any follow-through selling.
  • The technical setup still favours bullish traders and supports prospects for further gains.
  • A convincing break below the $24.40-30 area is needed to negate the positive outlook.

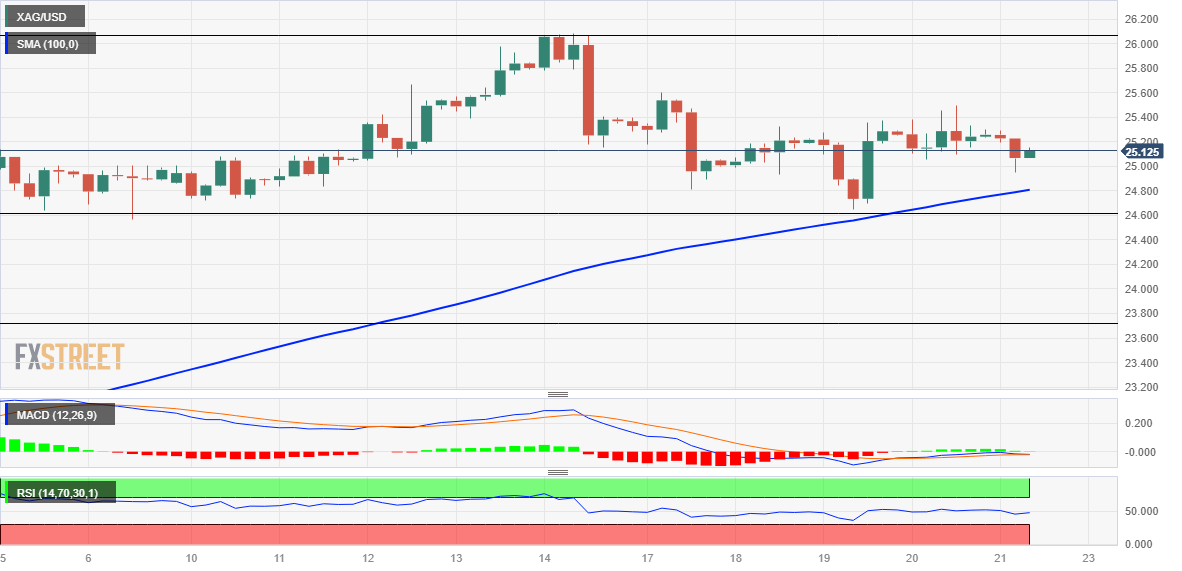
Silver comes under some selling pressure on the last day of the week and extends its steady intraday descent through the first half of the European session. The white metal slips below the $25.00 psychological mark, though manage to hold its neck above the 100-period Simple Moving (SMA) on the 4-hour chart.

Technical indicators on the 4-hour chart have just started gaining negative traction, though are holding comfortably in the bullish territory on the daily chart. This, in turn, supports prospects for the emergence of some dip-buying at lower levels and suggests that the path of least resistance for the XAG/USD is to the upside. Hence, any subsequent slide is more likely to find decent support near the 23.6% Fibonacci retracement level of the March-April rally, around the $24.65 zone.

This is followed by the $24.40-$24.30 strong horizontal resistance breakpoint, now turned support, which if broken might negate the positive outlook and shift the near-term bias in favour of bearish traders. The XAG/USD might then turn vulnerable to weaken further below the $24.00 mark and test the 38.2% Fibo. level. Some follow-through selling should pave the way for an extension of the recent pullback from a one-year high, around the $26.10 region touched last week.

On the flip side, the $25.50-$25.60 region now seems to have emerged as an immediate strong resistance, above which the XAG/USD is likely to make a fresh attempt to conquer the $26.00 mark. Some follow-through buying will mark a fresh bullish breakout and set the stage for a further near-term appreciating move.

Silver 4-hour chart

fxsoriginal

Key levels to watch

XAG/USD

Overview
Today last price25.12
Today Daily Change-0.17
Today Daily Change %-0.67
Today daily open25.29
 
Trends
Daily SMA2024.52
Daily SMA5022.69
Daily SMA10023.08
Daily SMA20021.38
 
Levels
Previous Daily High25.5
Previous Daily Low25.06
Previous Weekly High26.09
Previous Weekly Low24.72
Previous Monthly High24.16
Previous Monthly Low19.9
Daily Fibonacci 38.2%25.33
Daily Fibonacci 61.8%25.23
Daily Pivot Point S125.07
Daily Pivot Point S224.84
Daily Pivot Point S324.63
Daily Pivot Point R125.51
Daily Pivot Point R225.72
Daily Pivot Point R325.95

Author

Haresh Menghani

Haresh Menghani is a detail-oriented professional with 10+ years of extensive experience in analysing the global financial markets.

More from Haresh Menghani
Share:

Editor's Picks

EUR/USD stays near 1.1650 with fading momentum

EUR/USD holds ground after five days of losses, trading around 1.1650 during the Asian hours on Friday. The 14-day Relative Strength Index momentum indicator at 39 trends lower, confirming fading momentum rather than oversold conditions.

GBP/USD remains below 1.3450, nine-day EMA

GBP/USD remains subdued for the fourth consecutive day, trading around 1.3430 during the Asian hours on Friday. The momentum indicator 14-day Relative Strength Index at 51.9 is neutral, reflecting slower momentum after firm recent readings. An RSI drop back beneath 50 would strengthen the case for a deeper pullback.

Gold edges lower as USD preserves its recent gains ahead of US NFP report

Gold struggles to capitalize on the previous day's goodish rebound from the vicinity of the $4,400 mark and attracts fresh sellers during the Asian session on Friday. The US Dollar preserves its gains registered over the past two weeks and touches a nearly one-month high, undermining the commodity. 

Bitcoin, Ethereum and Ripple find key support, reviving rally hopes

Bitcoin, Ethereum, and Ripple steadied above key support levels on Friday after being rejected at mid-week resistance zones. The short-term recovery prospects remain intact if the top three cryptocurrencies by market capitalization hold these support zones.

2026 economic outlook: Clear skies but don’t unfasten your seatbelts yet

Most years fade into the background as soon as a new one starts. Not 2025: a year of epochal shifts, in which the macroeconomy was the dog that did not bark. What to expect in 2026? The shocks of 2025 will not be undone, but neither will they be repeated.

Pepe Price Forecast: PEPE risks 100-day EMA fallout as bullish interest fades

Pepe is under extreme selling pressure, trading in the red for the fifth consecutive day, down 1% at press time on Friday. Pepe’s decline following a 72% hike last week suggests a likely profit-booking phase, while on-chain data indicates declining network activity.