Silver Price Analysis: XAG/USD teases $26.00 inside weekly bearish pennant
- Silver consolidates monthly losses inside a bearish chart pattern.
- Sustained trading below short-term SMA, resistance line keeps sellers hopeful.
- Further losses envisioned on the clear break of $26.00.

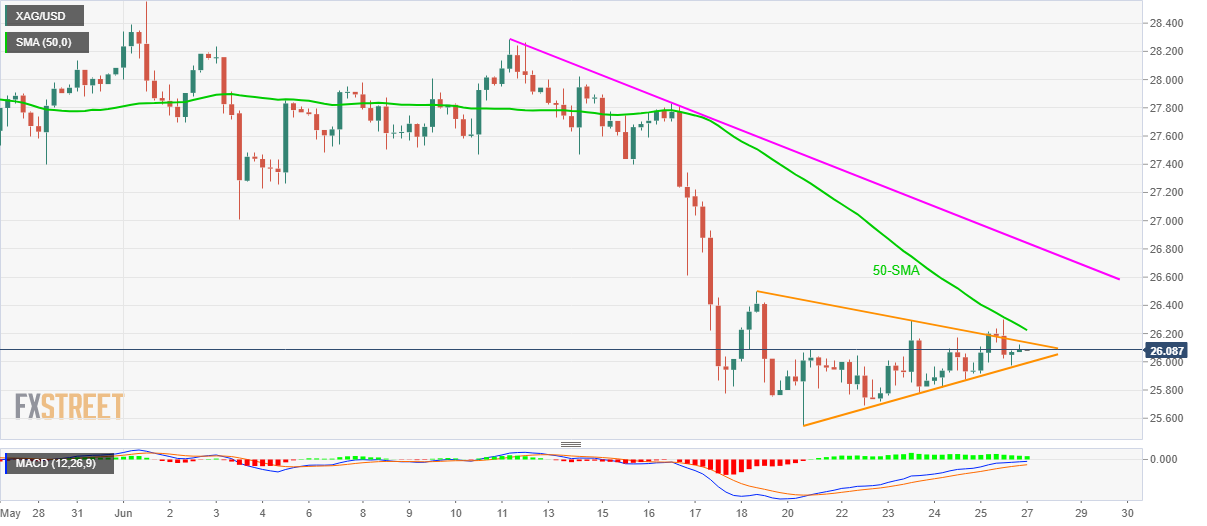
Silver takes a U-turn from intraday high to $26.10, up 0.08%, amid Monday’s Asian session. In doing so, the white metal remains inside a bearish pennant chart pattern while also justifying the U-turn from 50-SMA.
Considering the recently easy MACD histogram, coupled with the metal’s sustained trading below short-term SMA, silver is likely to confirm the bearish chart formation with a downside break of $25.99.
Following that, the monthly low surrounding $25.55 and March bottom around $24.80 will be in the spotlight ahead of the theoretical target near the yearly trough surrounding $23.75.
On the flip side, the formation’s resistance line close to $26.15 and the 50-SMA level of $26.22 guard the commodity’s short-term advances.
It should, however, be noted that a sustained rise past $26.22 will aim for a two-week-old resistance line near $26.85, a break of which should recall the silver bulls aiming for $28.00.
Silver: Four-hour chart
Trend: Further weakness expected
Author

Anil Panchal
FXStreet
Anil Panchal has nearly 15 years of experience in tracking financial markets. With a keen interest in macroeconomics, Anil aptly tracks global news/updates and stays well-informed about the global financial moves and their implications.


