|

Silver Price Analysis: XAG/USD struggles to break through 100-period SMA on H4

  • Silver struggles to gain any meaningful traction and oscillates in a narrow band on Monday.
  • The technical setup favours bullish traders and supports prospects for some intraday gains.
  • A convincing break below the 23.6% Fibo. is needed to negate the near-term positive bias.

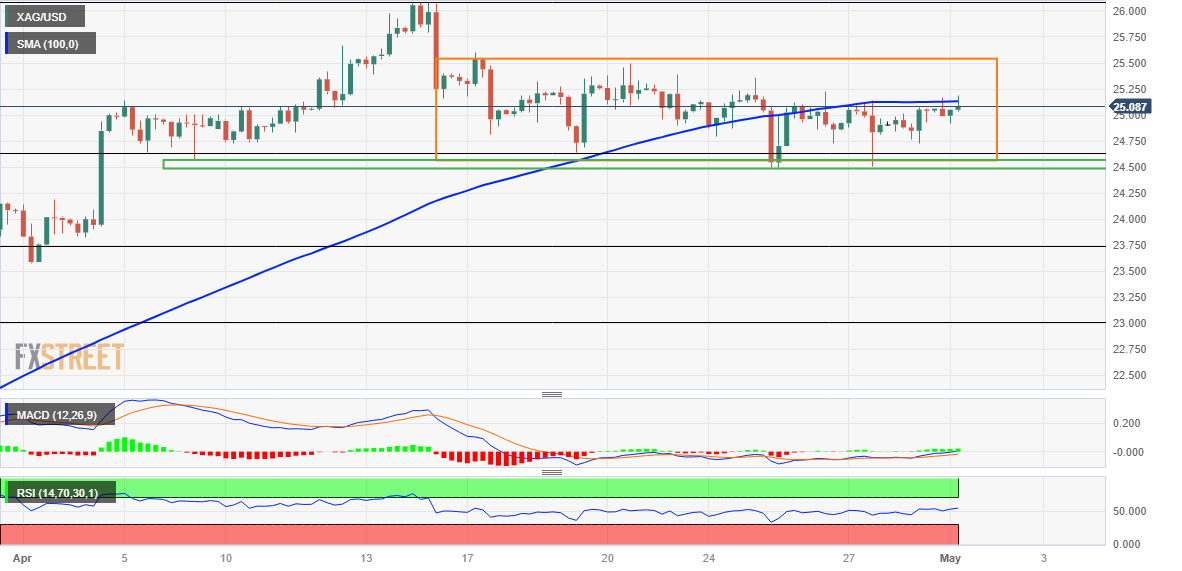
Silver reverses an intraday dip to sub-$25.00 levels and touches a three-day daily high during the early European session on Monday, though lacks follow-through. The white metal has been struggling to make it through the 100-period Simple Moving Average (SMA), warranting some caution for bullish traders and before positioning for an extension of the recent bounce from the $24.50-$24.40 horizontal support.

Looking at the broader picture, the XAG/USD is holding comfortably above the 23.6% Fibonacci retracement level of the March-April rally. Moreover, technical indicators on the daily chart maintain their bullish bias and have been gaining positive traction on hourly charts. This, in turn, supports prospects for some intraday appreciating move back towards the $25.50 supply zone. Some follow-through buying will negate any negative bias and pave the way for additional gains.

The XAG/USD might then make a fresh attempt to conquer the $26.00 round-figure mark and retest a one-year high touched on April 14. The positive momentum could get extended further towards the next relevant hurdle near the $26.25-$26.30 region en route to the 2022 swing high, just ahead of the $27.00 round-figure mark.

On the flip side, the $24.50-$24.40 region might continue to act as immediate strong support, which if broken decisively might prompt some technical selling. The subsequent downfall has the potential to drag the XAG/USD below the $24.00 mark, towards testing the 38.2% Fibo. level, around the $23.70 area. The corrective decline could get extended further towards the $23.35-$23.30 horizontal support before the metal drops to the $23.00 confluence, comprising the 50% Fibo. level and the 50-day SMA. 

Silver 4-hour chart

fxsoriginal

Key levels to watch

XAG/USD

Overview
Today last price25.09
Today Daily Change0.03
Today Daily Change %0.12
Today daily open25.06
 
Trends
Daily SMA2025.03
Daily SMA5023.07
Daily SMA10023.22
Daily SMA20021.57
 
Levels
Previous Daily High25.07
Previous Daily Low24.73
Previous Weekly High25.36
Previous Weekly Low24.49
Previous Monthly High26.09
Previous Monthly Low23.57
Daily Fibonacci 38.2%24.94
Daily Fibonacci 61.8%24.86
Daily Pivot Point S124.84
Daily Pivot Point S224.61
Daily Pivot Point S324.49
Daily Pivot Point R125.18
Daily Pivot Point R225.3
Daily Pivot Point R325.52

Author

Haresh Menghani

Haresh Menghani is a detail-oriented professional with 10+ years of extensive experience in analysing the global financial markets.

More from Haresh Menghani
Share:

Markets move fast. We move first.

Orange Juice Newsletter brings you expert driven insights - not headlines. Every day on your inbox.

By subscribing you agree to our Terms and conditions.

Editor's Picks

EUR/USD moves sideways below 1.1800 on Christmas Eve

EUR/USD struggles to find direction and trades in a narrow channel below 1.1800 after posting gains for two consecutive days. Bond and stock markets in the US will open at the usual time and close early on Christmas Eve, allowing the trading action to remain subdued. 

GBP/USD keeps range around 1.3500 amid quiet markets

GBP/USD keeps its range trade intact at around 1.3500 on Wednesday. The Pound Sterling holds the upper hand over the US Dollar amid pre-Christmas light trading as traders move to the sidelines heading into the holiday season. 

Gold retreats from record highs, trades below $4,500

Gold retreats after setting a new record-high above $4,520 earlier in the day and trades in a tight range below $4,500 as trading volumes thin out ahead of the Christmas break. The US Dollar selling bias remains unabated on the back of dovish Fed expectations, which continues to act as a tailwind for the bullion amid persistent geopolitical risks.

Bitcoin slips below $87,000 as ETF outflows intensify, whale participation declines

Bitcoin price continues to trade around $86,770 on Wednesday, after failing to break above the $90,000 resistance. US-listed spot ETFs record an outflow of $188.64 million on Tuesday, marking the fourth consecutive day of withdrawals.

Economic outlook 2026-2027 in advanced countries: Solidity test

After a year marked by global economic resilience and ending on a note of optimism, 2026 looks promising and could be a year of solid economic performance. In our baseline scenario, we expect most of the supportive factors at work in 2025 to continue to play a role in 2026.

Avalanche struggles near $12 as Grayscale files updated form for ETF

Avalanche trades close to $12 by press time on Wednesday, extending the nearly 2% drop from the previous day. Grayscale filed an updated form to convert its Avalanche-focused Trust into an ETF with the US Securities and Exchange Commission.