Silver Price Analysis: XAG/USD struggles for direction, stuck in a range above $20.00


  • Silver oscillates in a narrow trading band above the $20.00 round-figure mark on Friday.
  • The technical set-up favour bulls and supports prospects for a further appreciating move.
  • A convincing break below the $19.20 area is needed to negate any near-term positive bias.

Silver struggles to gain any meaningful traction on Friday and remains confined in a narrow range through the early European session. The white metal is currently hovering in neutral territory and so far, has managed to hold above the $20.00 psychological mark.

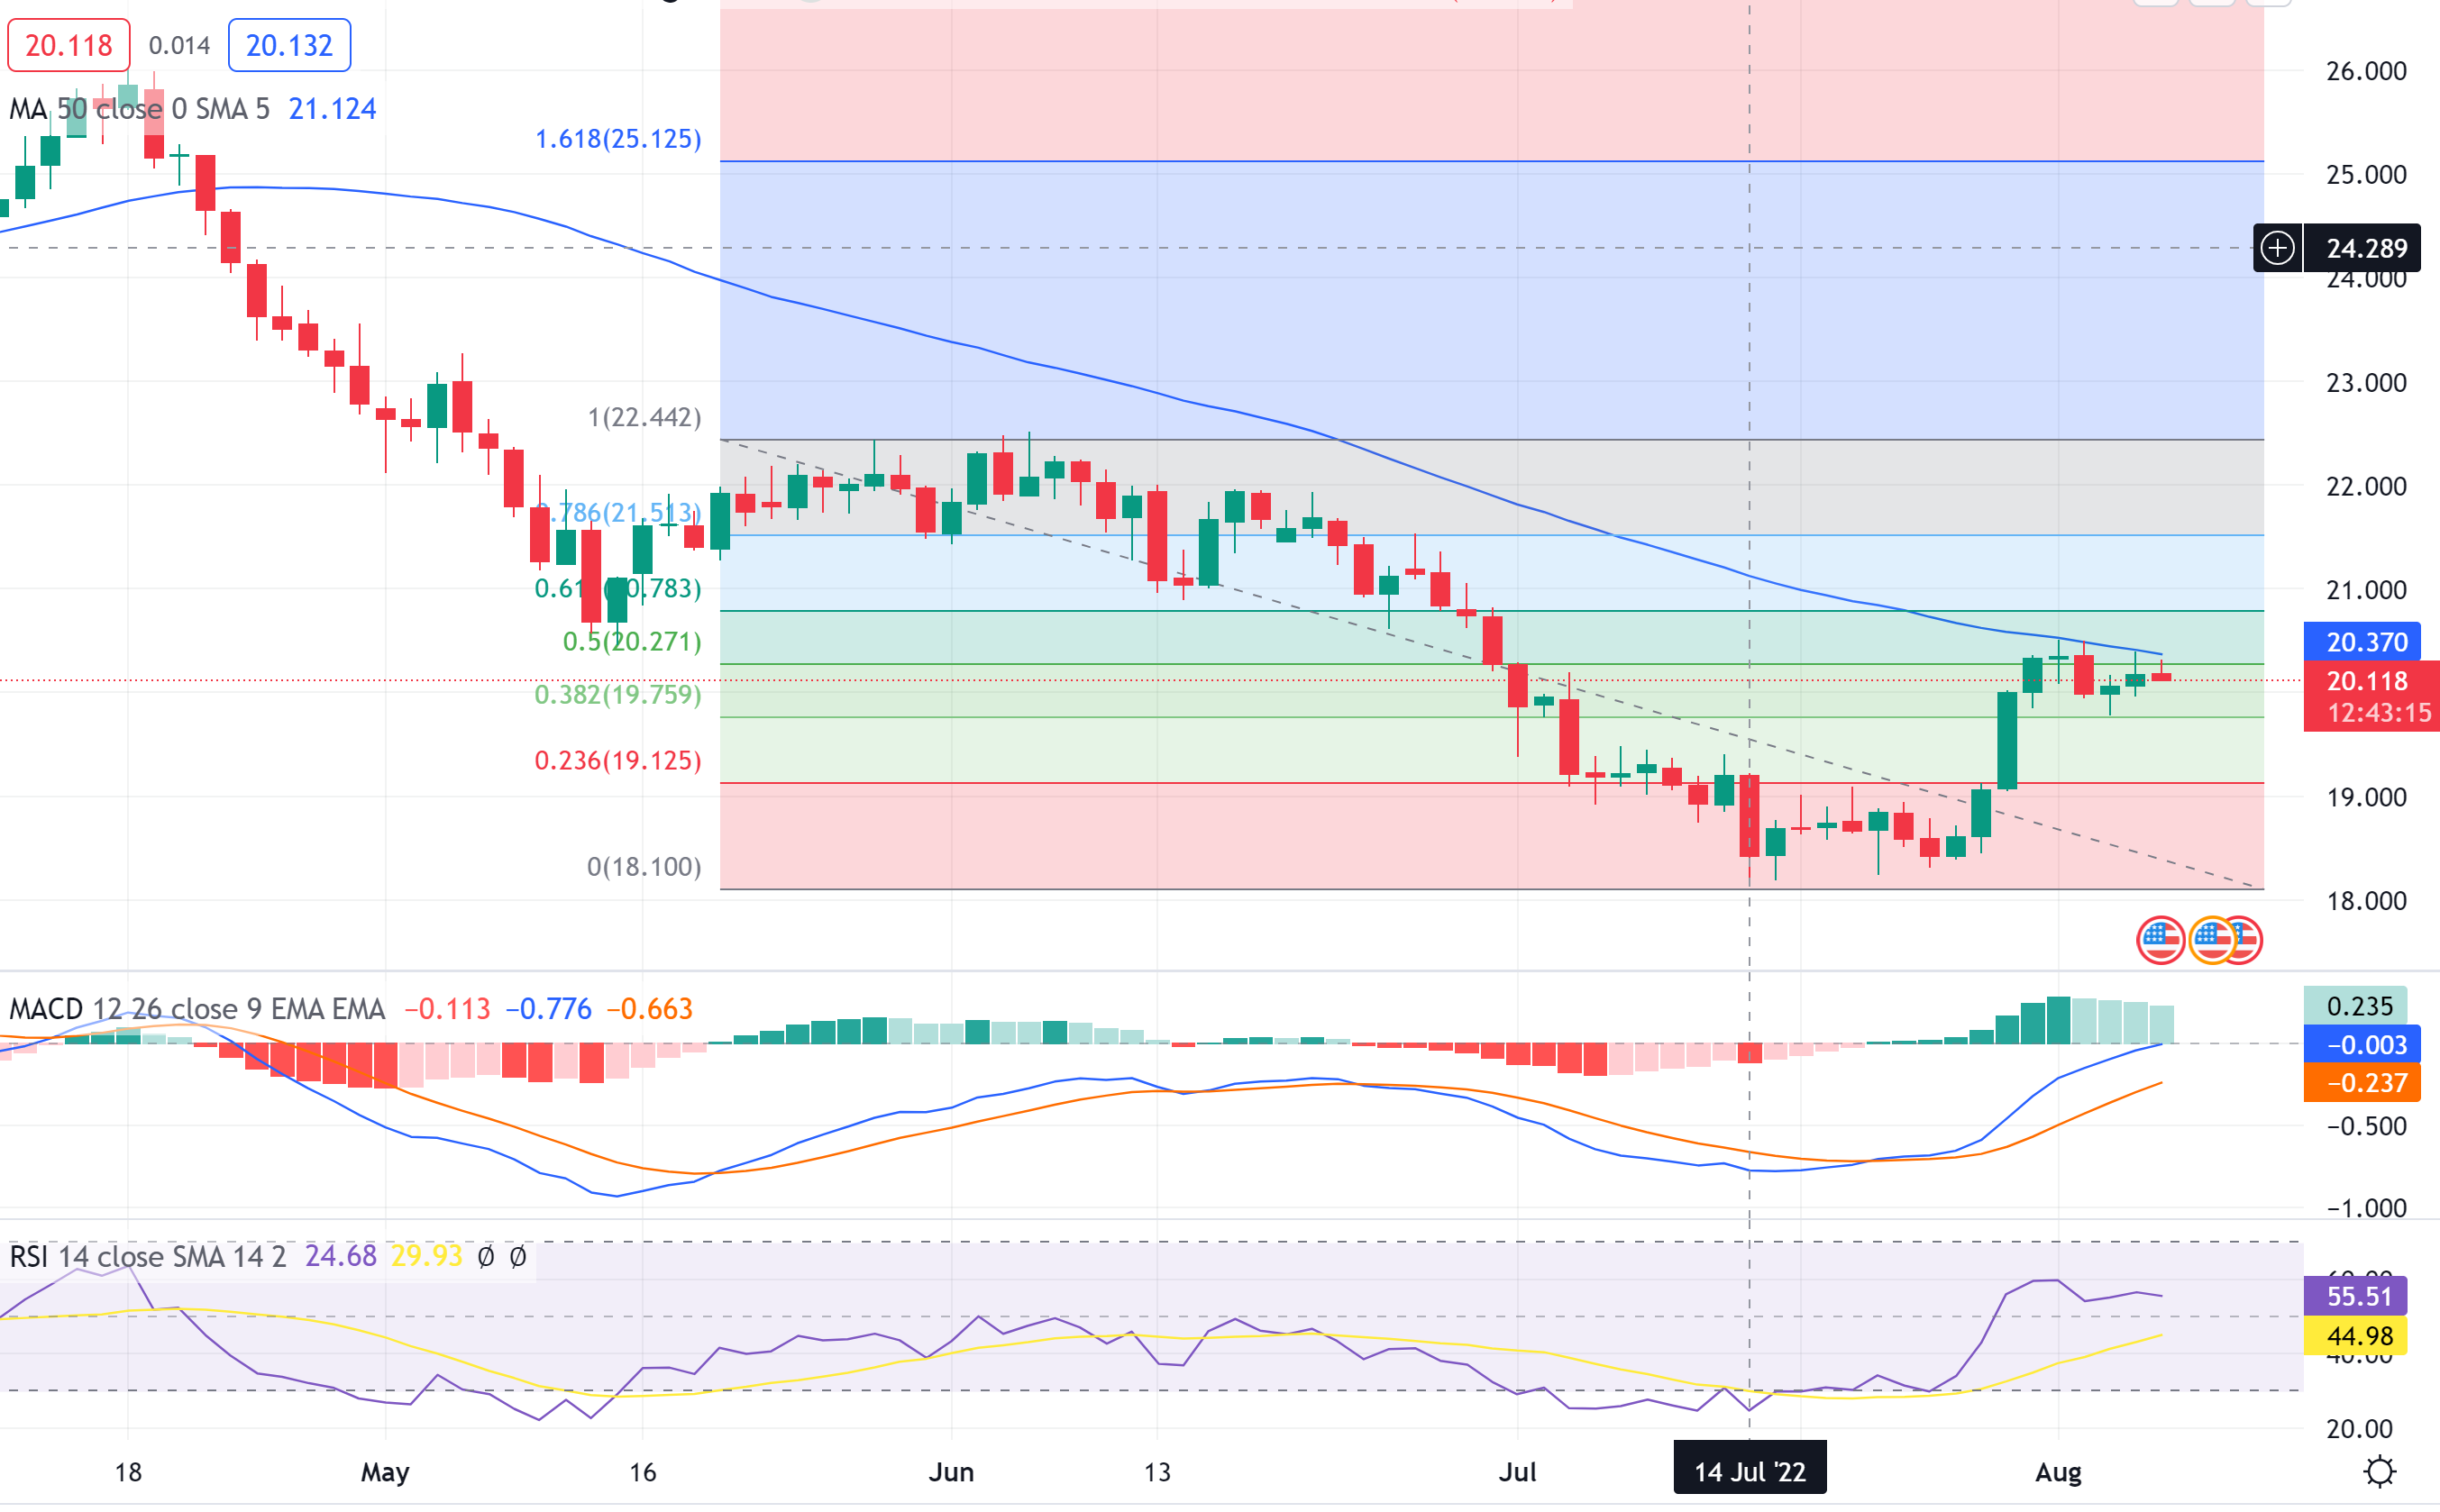
From a technical perspective, any subsequent move up is likely to confront stiff resistance near the mid-$20.00s confluence. The said barrier comprises the 50-day SMA and the 50% Fibonacci retracement level of the $22.52-$18.15 downfall, which should now act as a key pivotal point.

Positive oscillators on hourly/daily charts, meanwhile, support prospects for an eventual breakout through the aforementioned confluence hurdle. Hence, a subsequent positive move could lift the XAG/USD towards the 61.8% Fibo. level, around the $20.85 area, en route to the $21.00 mark.

The momentum could further get extended towards the next relevant hurdle near the $21.40-$21.50 area before the XAG/USD eventually aims to reclaim the $22.00 mark. The latter coincides with the 100-day SMA, which if cleared decisively would be seen as a fresh trigger for bullish traders.

On the flip side, the weekly swing low, around the $19.80-$19.75 region, which coincides with the 38.2% Fibo. level now seems to act as immediate support. Any further decline is more likely to stall and find decent support near the 23.6% Fibo. level, around the $19.20 region.

Some follow-through selling, leading to a subsequent break below the $19.00 mark, would shift the bias back in favour of bearish traders. The XAG/USD could then fall to the $18.40 intermediate support en route to the YTD low, around the $18.15 region touched on July 14.

Silver daily chart

Key levels to watch

XAG/USD

Overview
Today last price 20.19
Today Daily Change 0.02
Today Daily Change % 0.10
Today daily open 20.17
 
Trends
Daily SMA20 19.22
Daily SMA50 20.42
Daily SMA100 22.03
Daily SMA200 22.82
 
Levels
Previous Daily High 20.39
Previous Daily Low 19.97
Previous Weekly High 20.37
Previous Weekly Low 18.32
Previous Monthly High 20.37
Previous Monthly Low 18.15
Daily Fibonacci 38.2% 20.23
Daily Fibonacci 61.8% 20.13
Daily Pivot Point S1 19.96
Daily Pivot Point S2 19.75
Daily Pivot Point S3 19.54
Daily Pivot Point R1 20.39
Daily Pivot Point R2 20.6
Daily Pivot Point R3 20.81


Share: Feed news

Information on these pages contains forward-looking statements that involve risks and uncertainties. Markets and instruments profiled on this page are for informational purposes only and should not in any way come across as a recommendation to buy or sell in these assets. You should do your own thorough research before making any investment decisions. FXStreet does not in any way guarantee that this information is free from mistakes, errors, or material misstatements. It also does not guarantee that this information is of a timely nature. Investing in Open Markets involves a great deal of risk, including the loss of all or a portion of your investment, as well as emotional distress. All risks, losses and costs associated with investing, including total loss of principal, are your responsibility. The views and opinions expressed in this article are those of the authors and do not necessarily reflect the official policy or position of FXStreet nor its advertisers. The author will not be held responsible for information that is found at the end of links posted on this page.

If not otherwise explicitly mentioned in the body of the article, at the time of writing, the author has no position in any stock mentioned in this article and no business relationship with any company mentioned. The author has not received compensation for writing this article, other than from FXStreet.

FXStreet and the author do not provide personalized recommendations. The author makes no representations as to the accuracy, completeness, or suitability of this information. FXStreet and the author will not be liable for any errors, omissions or any losses, injuries or damages arising from this information and its display or use. Errors and omissions excepted.

The author and FXStreet are not registered investment advisors and nothing in this article is intended to be investment advice.

Recommended content


Recommended content

Editors’ Picks

EUR/USD retreats below 1.0700 after US GDP data

EUR/USD retreats below 1.0700 after US GDP data

EUR/USD came under modest bearish pressure and retreated below 1.0700. Although the US data showed that the economy grew at a softer pace than expected in Q1, strong inflation-related details provided a boost to the USD.

EUR/USD News

GBP/USD declines below 1.2500 as USD rebounds

GBP/USD declines below 1.2500 as USD rebounds

GBP/USD declined below 1.2500 and erased the majority of its daily gains with the immediate reaction to the US GDP report. The US economy expanded at a softer pace than expected in Q1 but the price deflator jumped to 3.4% from 1.8%. 

GBP/USD News

Gold drops below $2,320 as US yields shoot higher

Gold drops below $2,320 as US yields shoot higher

Gold lost its traction and turned negative on the day below $2,320 in the American session on Thursday. The benchmark 10-year US Treasury bond yield is up more than 1% on the day above 4.7% after US GDP report, weighing on XAU/USD.

Gold News

XRP extends its decline, crypto experts comment on Ripple stablecoin and benefits for XRP Ledger

XRP extends its decline, crypto experts comment on Ripple stablecoin and benefits for XRP Ledger

Ripple extends decline to $0.52 on Thursday, wipes out weekly gains. Crypto expert asks Ripple CTO how the stablecoin will benefit the XRP Ledger and native token XRP. 

Read more

After the US close, it’s the Tokyo CPI

After the US close, it’s the Tokyo CPI

After the US close, it’s the Tokyo CPI, a reliable indicator of the national number and then the BoJ policy announcement. Tokyo CPI ex food and energy in Japan was a rise to 2.90% in March from 2.50%.

Read more

Forex MAJORS

Cryptocurrencies

Signatures