|

Silver Price Analysis: XAG/USD struggles for a firm intraday direction, holds steady above $23.00

  • Silver oscillates in a narrow trading range above the $23.00 mark on Monday.
  • Mixed oscillators on hourly/daily charts warrant caution for aggressive traders.
  • A sustained break below the $22.65-70 area might negate any positive outlook.

Silver kicks off the new week on a subdued note, albeit manages to hold its neck above the $23.00 round-figure mark through the early European session. The mixed technical setup, meanwhile, warrants some caution before placing aggressive directional bets.

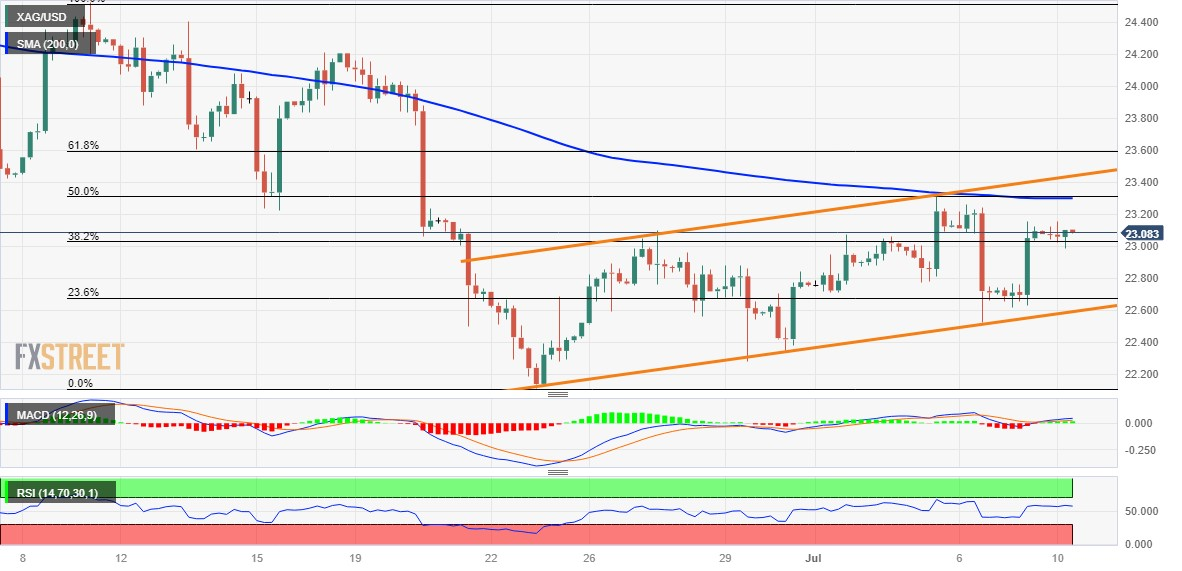
The recent recovery from the vicinity of the $22.00 mark, or the multi-month low touched in June, has been along an upward-sloping channel. Furthermore, last week's pullback from the $23.30 confluence - comprising the 50% Fibonacci retracement level of the downfall from the June peak and the 200-period Simple Moving Average (SMA) on the 4-hour chart - stalled near the lower end of the said channel. Moreover, positive oscillators on hourly charts favour bullish traders.

That said, technical indicators on the daily chart are yet to confirm a positive outlook. Hence, any subsequent move up might continue to face some resistance near the $23.30 confluence region. This is closely followed by the ascending trend-channel resistance, currently around the $23.45 region. A sustained strength beyond will confirm a positive breakout and lift the XAG/USD beyond the 61.8% Fibo. resistance near the $23.60 region, toward reclaiming the $24.00 mark.

The positive momentum could get extended further towards the $24.20-$24.25 intermediate barrier, above which the XAG/USD could climb back to the June monthly swing high, around the $24.55 region.

On the flip side, weakness back below the $23.00 mark, representing the 38.2% Fibo., is more likely to attract some buying and remain limited near the $22.65-$22.70 area, or the 23.6% Fibo. level. The latter should act as a pivotal point, which if broken could make the XAG/USD vulnerable to slide back towards the $22.mark. Some follow-through selling should pave the way for fall towards the $21.70-$21.65 zone en route to the $21.25 support and the $21.00 mark.

Silver 4-hour chart

fxsoriginal

Key levels to watch

XAG/USD

Overview
Today last price23.09
Today Daily Change0.01
Today Daily Change %0.04
Today daily open23.08
 
Trends
Daily SMA2023.14
Daily SMA5023.74
Daily SMA10023.4
Daily SMA20022.68
 
Levels
Previous Daily High23.15
Previous Daily Low22.62
Previous Weekly High23.31
Previous Weekly Low22.52
Previous Monthly High24.53
Previous Monthly Low22.11
Daily Fibonacci 38.2%22.95
Daily Fibonacci 61.8%22.82
Daily Pivot Point S122.74
Daily Pivot Point S222.41
Daily Pivot Point S322.21
Daily Pivot Point R123.28
Daily Pivot Point R223.49
Daily Pivot Point R323.82

Author

Haresh Menghani

Haresh Menghani is a detail-oriented professional with 10+ years of extensive experience in analysing the global financial markets.

More from Haresh Menghani
Share:

Editor's Picks

GBP/USD slides below 1.3250 after failing to break through 23.6% Fibo

The GBP/USD pair meets with a fresh supply during the Asian session on Wednesday and moves away from a nearly two-week high around the 1.3275 region, touched the previous day. Spot prices currently trade around the 1.3235 zone, down 0.20% for the day, as traders look to speeches from Bank of England Governor Andrew Bailey and Federal Reserve Chair Kevin Warsh for a fresh impetus.

EUR/USD keeps losses near 1.1400 ahead of Eurozone inflation data

EUR/USD keeps the offered tone intact near 1.1400 in early Europe on Wednesday, pressured by receding bets for aggressive tightening by the European Central Bank (ECB). Traders will take more cues from the preliminary reading of the Eurozone's Harmonized Index of Consumer Prices and the US Manufacturing PMI report due later in the day.

Gold sticks to bearish bias below $4,000 amid Fed hike bets and Iran risks

Gold attracts fresh sellers following the previous day's good two-way price swings, and weakens further below the $4,000 psychological mark through the Asian session. This marks the third straight day of a slide and keeps the precious metal closer to its lowest level since November 2025. Moreover, a bullish US Dollar suggests that the path of least resistance for the bullion is to the downside.

Solana: Retail confidence backs SOL testing 50-day EMA breakout near $75

Solana price extends gains, testing the 50-day Exponential Moving Average around $75.00. Although institutional demand for Solana remains weak, stabilizing retail confidence, with rising funding rates and steady Open Interest, supports the mild recovery. The technical outlook for SOL shifts mildly bullish, projecting a potential breakout rally toward the $100 mark.

Kevin Warsh isn't expected to say much in Sintra: That's exactly why markets will listen

Financial markets could find an important catalyst in the enchanting, fairytale-like landscape of  Sintra this week. The European Central Bank Forum will, as it does every year, gather the crème de la crème of central banks. The new boss at the Federal Reserve, who has clearly said that the Fed should stop explaining everything, will need to talk – and traders should listen.

Kevin Warsh isn't expected to say much in Sintra: That's exactly why markets will listen

Financial markets could find an important catalyst in the enchanting, fairytale-like landscape of Sintra this week. The ECB Forum will, as it does every year, gather the crème de la crème of central banks. The new boss at the Fed, who has clearly said that the Fed should stop explaining everything, will need to talk – and traders should listen.