Silver Price Analysis: XAG/USD struggles at 50-DMA and slumps below $23.00
- Silver extended its losses to seven consecutive days and stayed below $23.00.
- If XAG/USD drops below $22.70, further downside is seen below $22.00.
- Bulls reclaiming $23.00 could pave the way for a recovery.

Silver price erased earlier gains and turned negative, down 0.30% following a softer US inflation report, which initially bolstered XAG/USD prices. Nevertheless, as US Treasury bond yields pared its losses, the grey metal lost its shine. The XAG/USD is trading at $22.74, retesting a two-month-old support trendline.
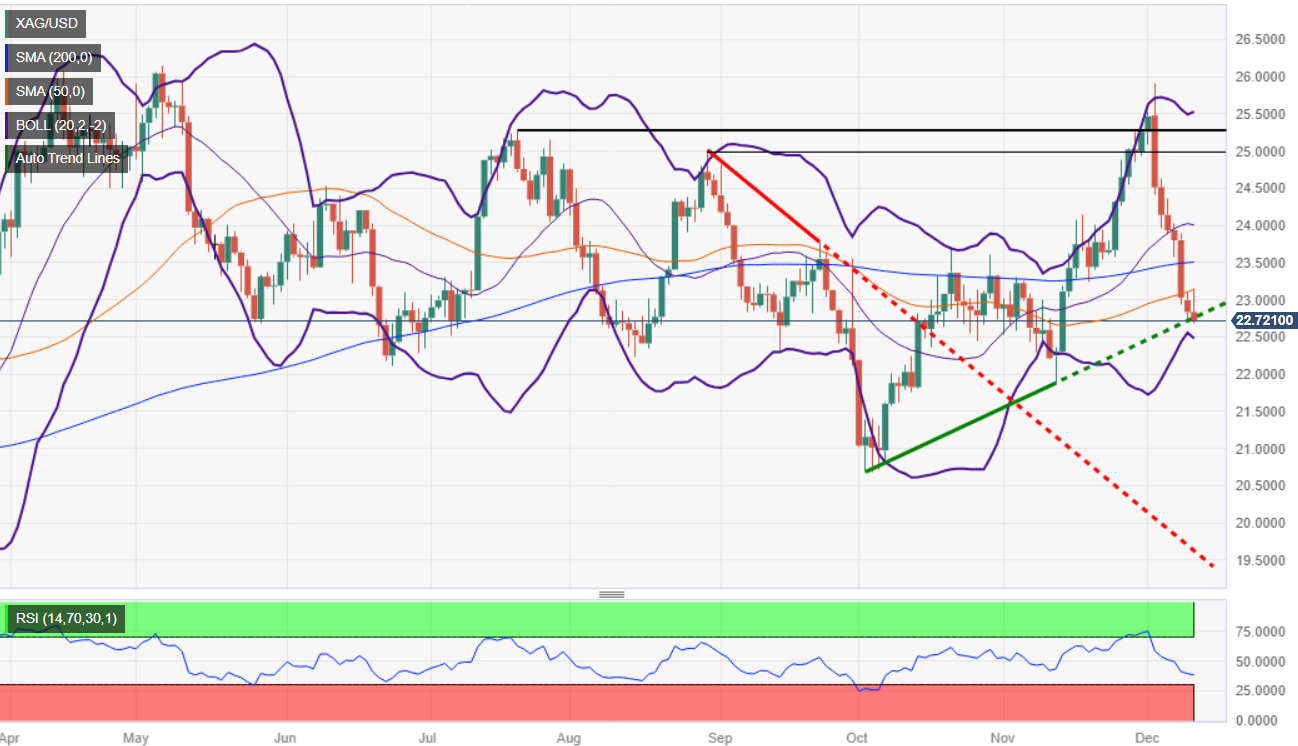
Silver remains neutral to downward bias, at the brisk of accelerating its downtrend if sellers push prices below the above-mentioned trendline. Once done, the next demand area would be the November 13 swing low of $21.88, followed by the October 6 daily low of $20.69.
On the other hand, if XAG/USD stays above that trendline and reclaims the $23.00 figure, the first technical barrier would be the 50-day moving average (DMA) at $23.12. Additional key resistance levels lie ahead, like the 100-DMA at $23.20, followed by the 200-DMA at $23.51. Once surpassed, the $24.00 figure would be up for grabs.
XAG/USD Price Analysis – Daily Chart
XAG/USD Technical Levels
Author

Christian Borjon Valencia
FXStreet
Markets analyst, news editor, and trading instructor with over 14 years of experience across FX, commodities, US equity indices, and global macro markets.


