|

Silver Price Analysis: XAG/USD sticks to gains near $23.25 area, remains below 100-day SMA

  • Silver regains positive traction on Wednesday and inches closer to the multi-week high.
  • The technical setup favours bulls and supports prospects for a further appreciating move.
  • A convincing break below the ascending channel support will negate the positive outlook.

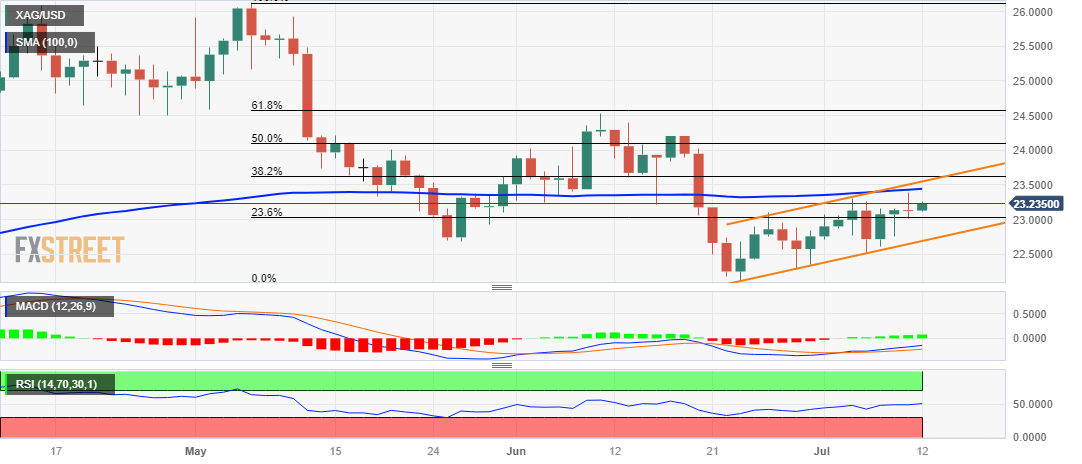
Silver attracts some dip-buying during the Asian session on Wednesday and stalls the overnight rejection slide from the vicinity of the 100-day Simple Moving Average (SMA). The white metal currently trades around the $23.25 region, up nearly 0.50% for the day, and remains well within the striking distance of a three-week high touched on Tuesday.

Looking at the broader picture, the recent recovery from the $22.00 neighbourhood, or the multi-month low set on June 23, has been along an upward-sloping channel. This points to a well-established short-term uptrend and favours bullish traders. Adding to this, technical indicators on the daily chart have just started gaining positive traction and support prospects for a further near-term appreciating move.

That said, any subsequent move up might continue to confront some resistance near the $23.45 region (100-day SMA), which is closely followed by the $23.55-$23.60 confluence. The latter comprises the top end of the aforementioned trend channel and the 38.2% Fibonacci retracement level of the downfall of May-June downfall from the YTD peak, which if cleared will confirm a fresh bullish breakout.

The XAG/USD might then accelerate the momentum towards reclaiming the $24.00 round figure, which coincides with the 50% Fibo. level. The positive momentum could get extended further towards the $24.20-$24.25 intermediate barrier en route to the June monthly swing high, around the $24.55 region, above which the commodity might eventually aim to reclaim the $25.00 psychological mark.

On the flip side, the 23.6% Fibo. level, around the $23.00 round figure, now seems to protect the immediate downside. Any further decline is more likely to attract buyers and remain cushioned near the ascending trend-channel support, currently pegged around the $22.75-$22.70 region. That said, a convincing break below could make the XAG/USD vulnerable to sliding back towards challenging the $22 mark.

Some follow-through selling should pave the way for a fall towards the $21.70-$21.65 zone, below which the XAG/USD could drop to the $21.25 support en route to the $21.00 round figure.

Silver daily chart
fxsoriginal

Key levels to watch

XAG/USD

Overview
Today last price23.23
Today Daily Change0.10
Today Daily Change %0.43
Today daily open23.13
 
Trends
Daily SMA2023.06
Daily SMA5023.65
Daily SMA10023.43
Daily SMA20022.71
 
Levels
Previous Daily High23.39
Previous Daily Low23.02
Previous Weekly High23.31
Previous Weekly Low22.52
Previous Monthly High24.53
Previous Monthly Low22.11
Daily Fibonacci 38.2%23.16
Daily Fibonacci 61.8%23.25
Daily Pivot Point S122.97
Daily Pivot Point S222.81
Daily Pivot Point S322.6
Daily Pivot Point R123.34
Daily Pivot Point R223.55
Daily Pivot Point R323.71

Author

Haresh Menghani

Haresh Menghani is a detail-oriented professional with 10+ years of extensive experience in analysing the global financial markets.


More from Haresh Menghani
Share:

Editor's Picks

GBP/USD surrenders some gains, back to 1.3420

GBP/USD holds on to moderate gains above 1.3400 the figure on Friday. Optimism surrounding the UK government’s leadership transition and expectations of further BoE tightening support the British Pound, while easing tensions in the Middle East and fading Fed rate-hike expectations weigh on the US Dollar.

EUR/USD turns positive, targets 1.1450

EUR/USD now picks up pace and advances toward the 1.1440 region on Friday, up modestly for the day. With no major economic data due, lingering uncertainty over the US-Iran conflict keeps investors cautious, limiting the pair's upside.

Gold remains offered, still below $4,100

Gold struggles to extend Thursday’s rebound and navigates below the $4,100 mark per troy ounce on Friday. Uncertainty surrounding the Middle East conflict limits the precious metal’s upside, which is also under pressure amid rising US Treasury yields across the curve.

Week ahead – US CPI and Warsh testimony to take centre stage, BoC eyed too

US inflation report and Warsh testimony to headline the week. Dollar to dominate amid slew of other US data and Mideast tensions. Amid fresh Iran escalation, China GDP to shed light on Q2 impact. Bank of Canada not expected to follow RBNZ with rate hike.

Five sessions, one round trip: Why the whipsaw is exactly what Warsh ordered

Markets opened July with a December hike as the base case and spent five trading sessions unlearning and relearning it. A 57K payrolls print bled the tightening bets out of the strip; a re-shut Strait of Hormuz is pushing them back in. Wednesday's minutes from the June Federal Open Market Committee meeting landed mid-round-trip, describing a world that had already stopped existing.

Five sessions, one round trip: Why the whipsaw is exactly what Warsh ordered

Markets opened July with a December hike as the base case and spent five trading sessions unlearning and relearning it. A 57K payrolls print bled the tightening bets out of the strip; a re-shut Strait of Hormuz is pushing them back in. Wednesday's minutes from the June FOMC meeting landed mid-round-trip, describing a world that had already stopped existing.