|

Silver Price Analysis: XAG/USD sticks to gains near $23.00 mark, lacks bullish conviction

  • Silver gains some positive traction, albeit struggles to capitalize on the move beyond $23.00.
  • The mixed technical setup warrants caution for bulls and before positioning for further gains.
  • A sustained break below the $22.50-45 area will be seen as a fresh trigger for bearish traders.

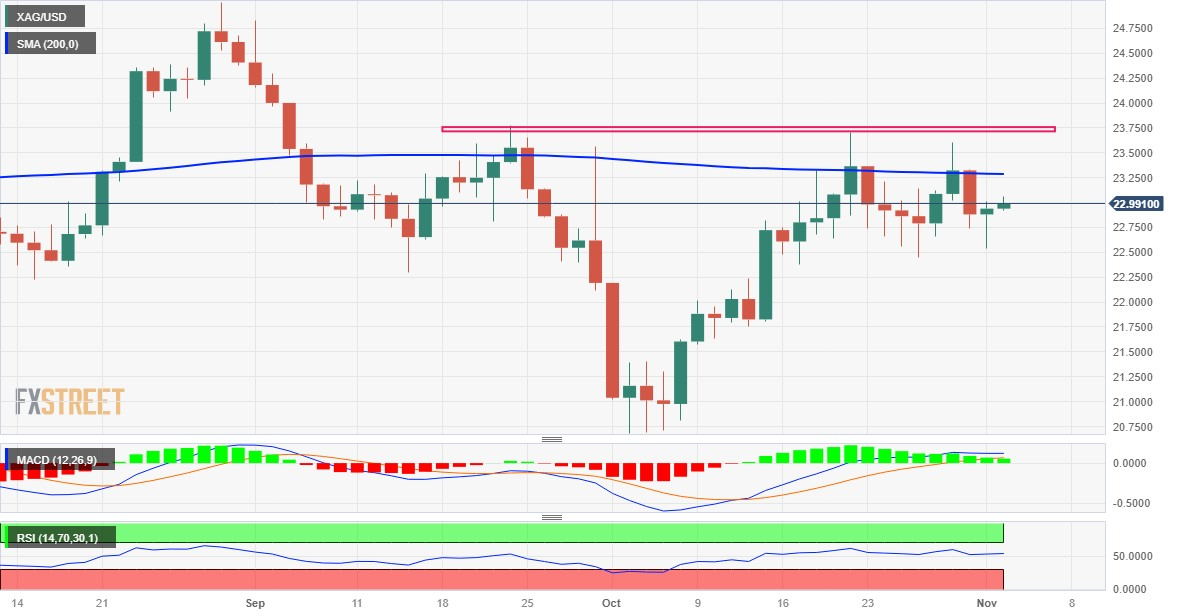
Silver (XAG/USD) builds on the previous day's goodish rebound from the vicinity of mid-$22.00s, or a multi-day low and gains some follow-through traction on Thursday. The white metal maintains its bid tone through the early part of the European session and currently trades around the $23.00 round-figure mark, up over 0.20% for the day.

The post-FOMC US Dollar (USD) selling bias remains unabated, which, in turn, is seen as a key factor driving flows towards the USD-denominated commodities, including the XAG/USD. This, along with positive technical indicators on the daily chart, supports prospects for a further appreciating move. That said, the recent repeated failures near the $23.60-$23.70 supply zone, which constitute the formation of a bearish multiple tops pattern, warrants caution for bullish traders.

In the meantime, any subsequent move up is more likely to confront stiff resistance near the very important 200-day Simple Moving Average (SMA), currently pegged around the $23.30 region. Bulls, meanwhile, need to wait for a convincing breakout through the $23.60-$23.70 barrier, before placing fresh bets. The XAG/USD might then aim to surpass the $24.00 mark and test the $24.20 hurdle before making a fresh attempt towards conquering the $25.00 psychological mark.

On the flip side, the $22.50-$22.45 region now seems to have emerged as an immediate strong support. Some follow-through selling, however, will be seen as a fresh trigger for bearish traders and drag the XAG/USD to the $22.00 mark. The downward trajectory could get extended further towards the $21.70 horizontal support en route to the $21.35-$21.30 region and the $21.00 mark. Silver could eventually drop to the $20.70-$20.65 area, or a seven-month low touched in October.

Silver daily chart

fxsoriginal

Technical levels to watch

XAG/USD

Overview
Today last price23
Today Daily Change0.06
Today Daily Change %0.26
Today daily open22.94
 
Trends
Daily SMA2022.57
Daily SMA5022.93
Daily SMA10023.22
Daily SMA20023.29
 
Levels
Previous Daily High23.01
Previous Daily Low22.54
Previous Weekly High23.36
Previous Weekly Low22.44
Previous Monthly High23.7
Previous Monthly Low20.68
Daily Fibonacci 38.2%22.83
Daily Fibonacci 61.8%22.72
Daily Pivot Point S122.65
Daily Pivot Point S222.36
Daily Pivot Point S322.18
Daily Pivot Point R123.12
Daily Pivot Point R223.3
Daily Pivot Point R323.59

Author

Haresh Menghani

Haresh Menghani is a detail-oriented professional with 10+ years of extensive experience in analysing the global financial markets.

More from Haresh Menghani
Share:

Editor's Picks

AUD/USD eyes 0.7150 barrier nine-day EMA

AUD/USD inches higher after registering modest losses in the previous day, trading around 0.7130 during the Asian hours. The technical analysis of the daily chart indicates that the pair is moving sideways within the rectangle pattern, suggesting a consolidation as neither the bulls nor the bears have enough momentum to take control of the market.

USD/JPY trades below 160.00 intervention threshold; bullish bias intact

The USD/JPY pair attracts some sellers during the Asian session amid fears that authorities will step in again to prop up the Japanese Yen. Furthermore, the Israel-Lebanon truce prompts some profit-taking around the US Dollar and exerts downward pressure on the currency pair.

Gold defends 200-day SMA at $4,425, but for how long?

Gold is attempting a tepid recovery toward $4,500 early Thursday, as renewed optimism in the Mideast geopolitical front calms market nerves. This cautious optimism across Asian markets weighs on Oil prices, and diminishes the US Dollar’s safe-haven appeal, helping Gold stage a decent comeback from the weekly low of $4,424.


Hyperliquid: ETF demand, capital rotation fuel HYPE rally as Bitcoin melts

Hyperliquid price sustains an upward trend near its all-time high of $75.76 on Thursday after posting 80% gains in May, while Bitcoin (BTC) retraces below $65,000, triggering a market-wide panic.

Kevin Warsh takes the Fed helm: What it means for the US Dollar
The Federal Reserve moves away from the highly predictable "forward guidance" model of the Jerome Powell era to a new “Kevin Warsh environment”, characterized by less communication, more policy surprises, and an increased focus on the Fed's complex balance sheet.
Recession on paper: What really moves the Canadian Loonie now?

Statistics Canada handed the headline writers a gift and the analysts a headache. Real GDP shrank 0.1% on an annualized basis in the first quarter, and with the fourth quarter of 2025 revised down to a 1.0% contraction, that is two negative quarters in a row, the textbook definition of a technical recession and Canada's first since the pandemic.