|

Silver Price Analysis: XAG/USD stays bullish despite latest pullback from $23.00

  • Silver price pares intraday gains at the highest level in a week during three-day uptrend.
  • Overbought RSI prods XAG/USD bulls below $23.30-25 resistance confluence.
  • Sellers need validation from three-day-old resistance line, 100-HMA.

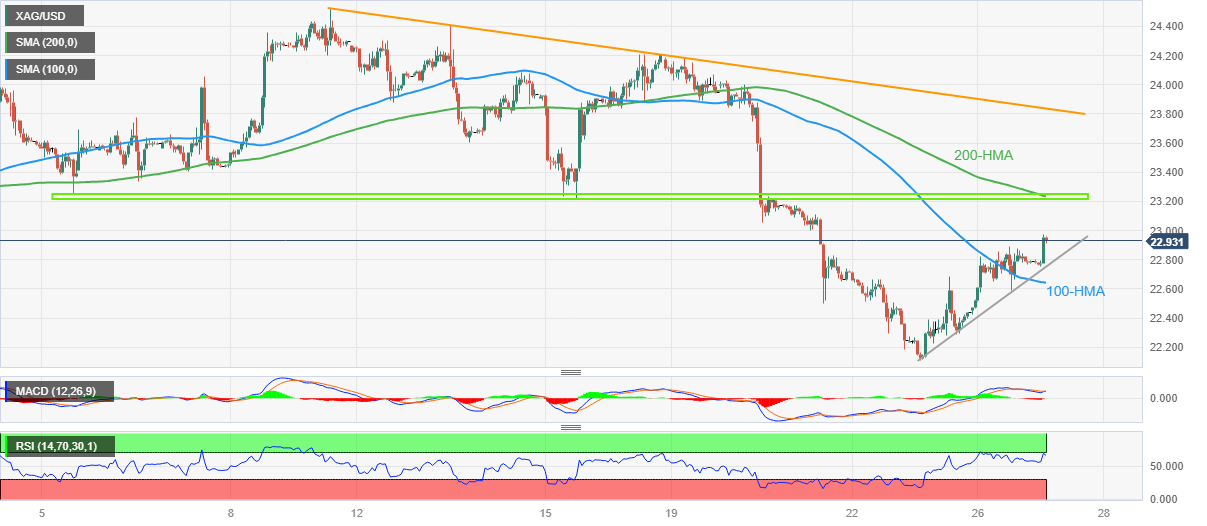
Silver Price (XAG/USD) remains on the front foot at around $22.95 as it remains firmer for the third consecutive day despite the latest retreat from the intraday high. The quote’s latest pullback could be linked to the overbought RSI (14).

However, the looming bull cross on the MACD and the XAG/USD’s sustained trading beyond the 100-Hour Moving Average (HMA), as well as an ascending trend line from Friday, keeps the Silver buyers hopeful.

As a result, the XAG/USD bulls are all set to prod the convergence of the 200-HMA and a three-week-old horizontal resistance area surrounding $23.30.

Following that, the June 13 swing low of around $23.60 and a downward-sloping resistance line from June 09, close to $23.85 at the latest, could challenge the Silver buyers before directing them to the monthly high of around $24.55.

On the contrary, the aforementioned rising support line from Friday, near $22.80 by the press time, restricts the immediate downside of the Silver price. Also acting as a short-term downside filter is the 100-HMA surrounding $22.60.

In a case where the Silver bears keep the reins past $22.60, the odds of witnessing a slump towards the monthly low of near $22.10 and then to the $22.00 round figure can’t be ruled out.

Silver Price: Hourly chart
Trend: Limited upside expected

Additional important levels

Overview
Today last price22.92
Today Daily Change0.14
Today Daily Change %0.61%
Today daily open22.78
 
Trends
Daily SMA2023.52
Daily SMA5024.14
Daily SMA10023.32
Daily SMA20022.51
 
Levels
Previous Daily High22.89
Previous Daily Low22.42
Previous Weekly High24.2
Previous Weekly Low22.11
Previous Monthly High26.14
Previous Monthly Low22.68
Daily Fibonacci 38.2%22.71
Daily Fibonacci 61.8%22.6
Daily Pivot Point S122.51
Daily Pivot Point S222.23
Daily Pivot Point S322.04
Daily Pivot Point R122.98
Daily Pivot Point R223.17
Daily Pivot Point R323.45

Author

Anil Panchal

Anil Panchal

FXStreet

Anil Panchal has nearly 15 years of experience in tracking financial markets. With a keen interest in macroeconomics, Anil aptly tracks global news/updates and stays well-informed about the global financial moves and their implications.


More from Anil Panchal
Share:

Editor's Picks

AUD/USD remains depressed near 0.6950 after RBA minutes

AUD/USD attracts follow-through selling during Tuesday’s Asian session, looking to extend the overnight rejection slide from 0.7000, or a two-week top, following the release of RBA meeting Minutes. The US Dollar retains a bullish undertone near its highest level since April 2025 as energy-driven inflation risks keep December Fed rate hike bets firmly on the table. Adding to this, geopolitical risks further underpin the safe-haven USD.

USD/JPY eases from two-week top, hovers near 158.50 amid looming intervention risk

USD/JPY edges lower during the Asian session on Tuesday, snapping a two-day winning streak and pulling back from an over two-week top touched the previous day, despite Japan's soft PPI print. Bulls turn cautious amid speculation that authorities will step in to prop up the Japanese Yen, which, in turn, weighs on the currency pair. The downside, however, seems limited as the US Dollar stands firm near its highest level since April 2025, bolstered by the hawkish Fed and geopolitical uncertainties.

Gold struggles above $4.150 as bullish USD and elevated bond yields weigh

Gold remains depressed during the Asian session on Tuesday as elevated US Treasury yields and a hawkish Fed keep the US Dollar near its highest level since April 2025. Adding to this, persistent geopolitical uncertainties stemming from Middle East conflicts continue to underpin the safe-haven buck, which, in turn, is seen as weighing on the bullion. Traders now look to US inflation figures for some impetus ahead of Fed Chair Kevin Warsh's appearance on Friday.

Bitcoin shows bottoming signs despite recent macro pressures

Bitcoin remained range-bound above $82,000 on Monday as upcoming US economic data and onchain indicators weigh on market sentiment. Crypto trading firm QCP Group stated in its Monday report that Bitcoin has maintained a firmer footing a year after the market’s largest single-day liquidation event.

Earnings preview US and Europe: Can the stock market rally continue?
Stocks have been remarkably resilient this year. They have navigated geopolitical turmoil, an energy price spike and surging global bond yields which is rapidly pushing up the cost of borrowing. US blue chip stocks are now in their 4th year of a bull market, however, they now face their toughest test of Q4 so far, the latest earnings updates.
Has Bitcoin really escaped the macro forces it was built to fight?
Over 17 years ago, Satoshi Nakamoto designed Bitcoin (BTC) on the back of a global financial crisis as an alternative to the global monetary system outside the control of central banks, governments and traditional intermediaries. This raises a key question: has Bitcoin really become independent of the macroeconomic forces it was built to challenge?