|

Silver Price Analysis: XAG/USD soars to three-week high, pushed by US employment report

  • Silver breaks through ley technical levels, eyes resistance at $24.49.
  • Buyers dominate XAG/USD market as RSI crosses 50-midline.
  • Falling below the EMA confluence at $23.88-$23.76 could challenge $23.25 weekly lows.

Silver price skyrockets following a worse-than-expected employment report in the United States (US), which sent US bond yields plunging, a headwind for the US Dollar (USD). Therefore, XAG/USD is advancing sharply to new three-week highs, exchanging hands at around $24.18.

XAG/USD Price Analysis: Technical outlook

XAG/USD shifted from neutral biased to upwards, claiming essential technical levels on its way north but capped by resistance at April 25 daily low at $24.49. XAG/USD’s jump in price action spurred a reaction in oscillators, with the Relative Strength Index (RSI) indicator crossing above the 50-midline, while the three-day Rate of Change (RoC) depicts buyers in charge.

Therefore, the XAG/USD path of least resistance is upwards. That said, the XAG/USD first resistance would be $24.49, followed by the $25.00 figure. Once cleared, Silver could rally toward the May 11 high at $25.47, followed by the May 10 swing high at $25.91.

Conversely, if XAG/USD drops below the confluence of the 50 and 20-day Exponential Moving Averages (EMAs) at $23.88-$23.76, that could open the door to challenging weekly lows of $23.25.

XAG/USD Price Action – Daily chart
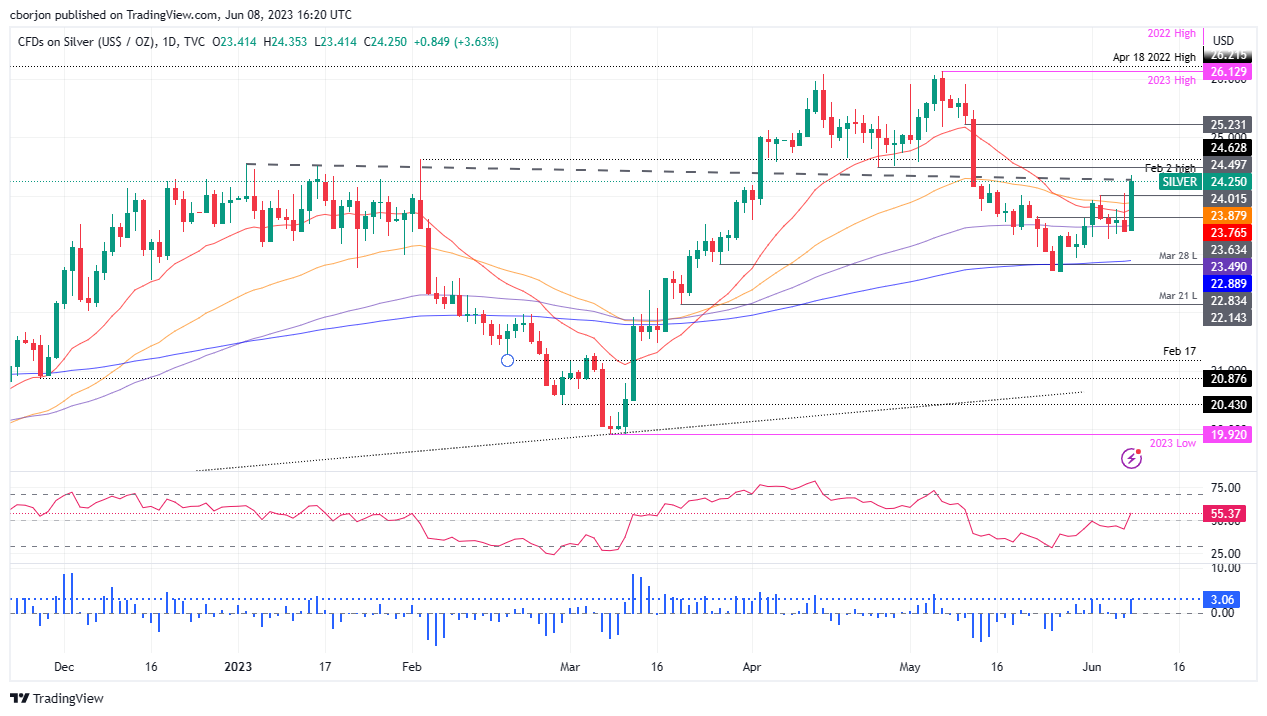
XAG/USD Daily chart

XAG/USD

Overview
Today last price24.23
Today Daily Change0.79
Today Daily Change %3.37
Today daily open23.44
 
Trends
Daily SMA2023.56
Daily SMA5024.47
Daily SMA10023.34
Daily SMA20022.2
 
Levels
Previous Daily High24.06
Previous Daily Low23.4
Previous Weekly High24.02
Previous Weekly Low22.93
Previous Monthly High26.14
Previous Monthly Low22.68
Daily Fibonacci 38.2%23.65
Daily Fibonacci 61.8%23.81
Daily Pivot Point S123.21
Daily Pivot Point S222.98
Daily Pivot Point S322.56
Daily Pivot Point R123.86
Daily Pivot Point R224.28
Daily Pivot Point R324.51

Author

Christian Borjon Valencia

Markets analyst, news editor, and trading instructor with over 14 years of experience across FX, commodities, US equity indices, and global macro markets.


More from Christian Borjon Valencia
Share:

Editor's Picks

GBP/USD hits multi-week tops around 1.3560

GBP/USD gathers fresh steam and advances to new three-month peaks near the 1.3560 zone on Friday. Cable’s sharp move higher comes after three daily drops in a row and follows the increasing selling pressure hurting the Greenback.

EUR/USD pops to fresh two-month highs, targets 1.1600

EUR/USD advances markedly, revisiting the upper 1.1500s for the first time since mid-June. The pair’s sharp uptick comes on the back of a strong retracement in the US Dollar amid BoJ intervention chatter and despite steady uncertainty in the Middle East.

Gold picks up pace, approaches $4,400

Gold rebounds toward the $4,400 mark per troy ounce on Friday, reversing the previous day’s pullback. The precious metal’s recovery comes as fresh and intense weakness keep weighing on the US Dollar, while traders keep assessing easing expectations of an imminent Fed interest rate hike and the situation from the Middle East.

Pi Network Price Forecast: PI extends consolidation as bulls eye $0.10
Pi Network (PI) price holds steady on Friday, maintaining a consolidating tone for three consecutive days. Mild retail strength in the PI token remains stable, with Open Interest above $9 million, while social buzz eases. PI token’s technical outlook is mixed, as bearish momentum wanes to neutral, with bulls eyeing the $0.1000 psychological level.
 Weekly focus: Some relief in US inflation concerns

Actual inflation data for July came out as expected with a 0.1% m/m increase in headline CPI and 0.2% excluding food and energy. Annual headline inflation remains too high at 3.4% and means that wage earners are experiencing stagnating spending power at best, and core inflation is a bit higher than the inflation target of two percent would suggest.

Why is Crude Oil priced for a reopening the ships haven't made?
Fourteen vessels crossed the Strait of Hormuz on Tuesday. Before the war, the count ran near 120 a day. In the sessions since the waterway was publicly declared open, Brent has drifted back to $87 and West Texas Intermediate (WTI) to $81, both a little lower again on Wednesday, with daily momentum on each unwound from the top of its range in late July to the low twenties now.















