|

Silver Price Analysis: XAG/USD slips despite weakening USD, falling US bond yields

  • Silver price slides from a daily high of nearly $26.00, down nearly 1%.
  • Disinflationary trends in the US economy persist, but core readings hold at 5.5% YoY.
  • XAG/USD technical outlook suggests the potential for further decline, testing key support levels.

Silver price slides after hitting a daily high of $25.91, following the release of US inflation figures continued to show that the economy is in a disinflationary process. Nevertheless, core readings are clinging to the 5.5% YoY barrier, which could warrant further tightening by the Fed. The XAG/USD is trading at around $25.30s, surprisingly down almost 1%, even though the US T-bond yields and the US Dollar (USD) remained down.

XAG/USD Price Analysis: Technical outlook

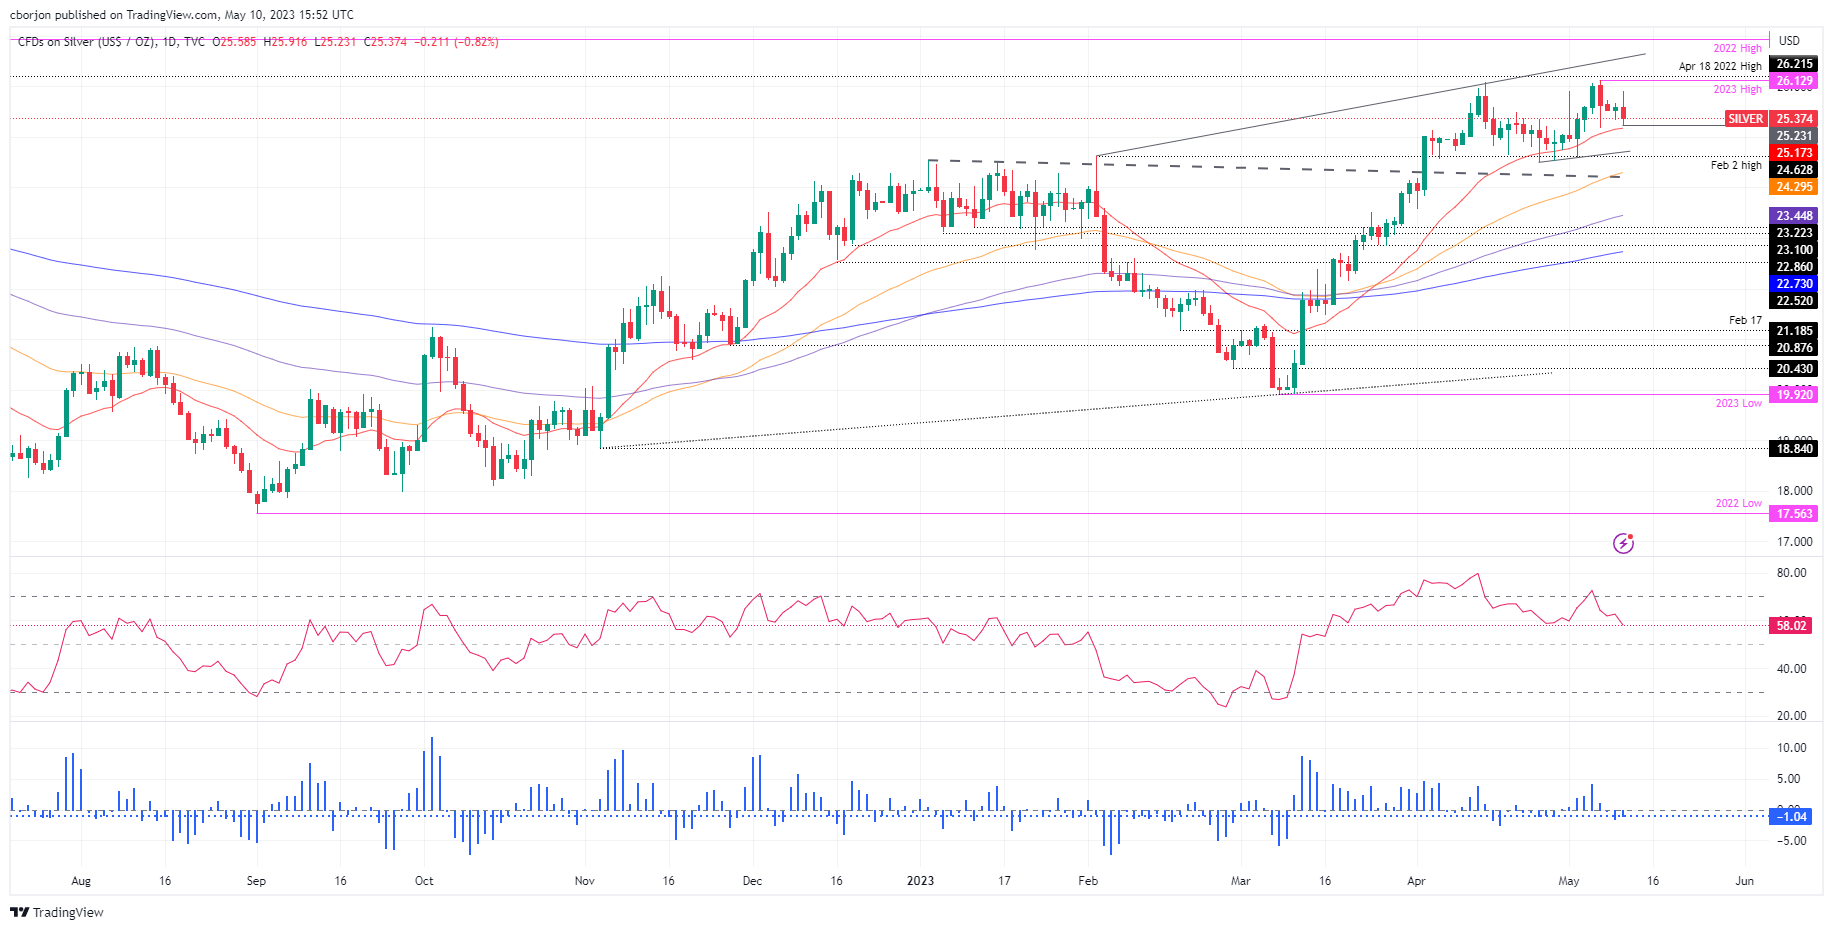
The XAG/USD daily chart suggests that sellers are gathering momentum, even though the uptrend remains intact. The Relative Strength Index (RSI) indicator flashes the previously mentioned, with the RSI edging towards its neutral level, while the 3-day Rate of Change (RoC) registers volatility in negative readings.

If XAG/USD continued to trend lower would test the 20-day Exponential Moving Average (EMA) at $25.17. In a decisive break, XAG/USD sellers will target the $25.00 figure, followed by the confluence of the 15-day upslope trendline and the February 2 high, turning support at around $24.60/70. A breach of the latter, XAG would slide toward the confluence of a five-month-old previous resistance trendline now support and the 50-day EMA at 24.29/40.

Conversely, the XAG/USD could resume its uptrend once buyers step in and reclaim the May 9 daily low of $25.33. In that outcome, the first resistance would be the May 9 high of $25.67, followed by the $26.00 figure.

XAG/USD Price Action – Daily Chart

XAG/USD Daily chart

XAG/USD

Overview
Today last price25.35
Today Daily Change-0.26
Today Daily Change %-1.02
Today daily open25.61
 
Trends
Daily SMA2025.33
Daily SMA5023.66
Daily SMA10023.37
Daily SMA20021.78
 
Levels
Previous Daily High25.68
Previous Daily Low25.33
Previous Weekly High26.14
Previous Weekly Low24.58
Previous Monthly High26.09
Previous Monthly Low23.57
Daily Fibonacci 38.2%25.54
Daily Fibonacci 61.8%25.46
Daily Pivot Point S125.4
Daily Pivot Point S225.19
Daily Pivot Point S325.05
Daily Pivot Point R125.75
Daily Pivot Point R225.89
Daily Pivot Point R326.1

Author

Christian Borjon Valencia

Christian Borjon began his career as a retail trader in 2010, mainly focused on technical analysis and strategies around it. He started as a swing trader, as he used to work in another industry unrelated to the financial markets.

More from Christian Borjon Valencia
Share:

Markets move fast. We move first.

Orange Juice Newsletter brings you expert driven insights - not headlines. Every day on your inbox.

By subscribing you agree to our Terms and conditions.

Editor's Picks

EUR/USD struggles to extend advance above 1.1800

The EUR/USD pair posts a fresh weekly low near 1.1740 during the Asian trading session on Wednesday. The major currency pair is under pressure as the US Dollar edges higher despite Federal Open Market Committee minutes of the December policy meeting, released on Tuesday, showing that most policymakers stressed the need for further interest rate cuts.

GBP/USD tests 1.3450 support after moving below nine-day EMA

GBP/USD remains subdued for the second consecutive day, trading around 1.3460 during the Asian hours on Wednesday. The technical analysis of the daily chart indicates a weakening of a bullish bias as the pair is positioned slightly below the lower boundary of the ascending channel pattern.

Gold jumps on US rate cut prospects, safe-haven demand

Gold price extends the rally above $4,350 during the early European trading hours on Wednesday. Gold's price has surged about 65% this year and is set to record its biggest annual gains since 1979. The rally in the precious metal is bolstered by the prospect of further US interest rate cuts in 2026. Lower interest rates could reduce the opportunity cost of holding Gold, supporting the non-yielding precious metal.

Bitcoin, Ethereum and XRP prepare for a potential New Year rebound

Bitcoin, Ethereum, and Ripple are holding steady on Wednesday after recording minor gains on the previous day. Technically, Bitcoin could extend gains within a triangle pattern while Ethereum and Ripple face critical overhead resistance. 

Economic outlook 2026-2027 in advanced countries: Solidity test

After a year marked by global economic resilience and ending on a note of optimism, 2026 looks promising and could be a year of solid economic performance. In our baseline scenario, we expect most of the supportive factors at work in 2025 to continue to play a role in 2026.

Crypto market outlook for 2026

Year 2025 was volatile, as crypto often is.  Among positive catalysts were favourable regulatory changes in the U.S., rise of Digital Asset Treasuries (DAT), adoption of AI and tokenization of Real-World-Assets (RWA).