|

Silver Price Analysis: XAG/USD sits near multi-week top, flirts with $24.35-40 barrier

  • Silver regains positive traction on Tuesday, albeit lacks follow-through.
  • Positive oscillators on the daily chart support prospects for further gains.
  • A break below $23.80 support might prompt aggressive technical selling.

Silver retests a three-week high on Tuesday, albeit struggles to capitalize on the move and remains below the $24.35-$24.40 area through the early European session.

The said hurdle might now act as a pivotal point, which if cleared decisively will set the stage for an extension of the recent rally from the $22.20 area, or the lowest level since June 23 touched earlier this month. Given that technical indicators on the daily chart have just started gaining positive traction, the XAG/USD might then aim to surpass the $24.55-$24.60 intermediate barrier and reclaim the $25.00 psychological mark. The positive move could get extended further towards the $25.25 zone, or the July monthly swing high, en route to the $26.00 round figure.

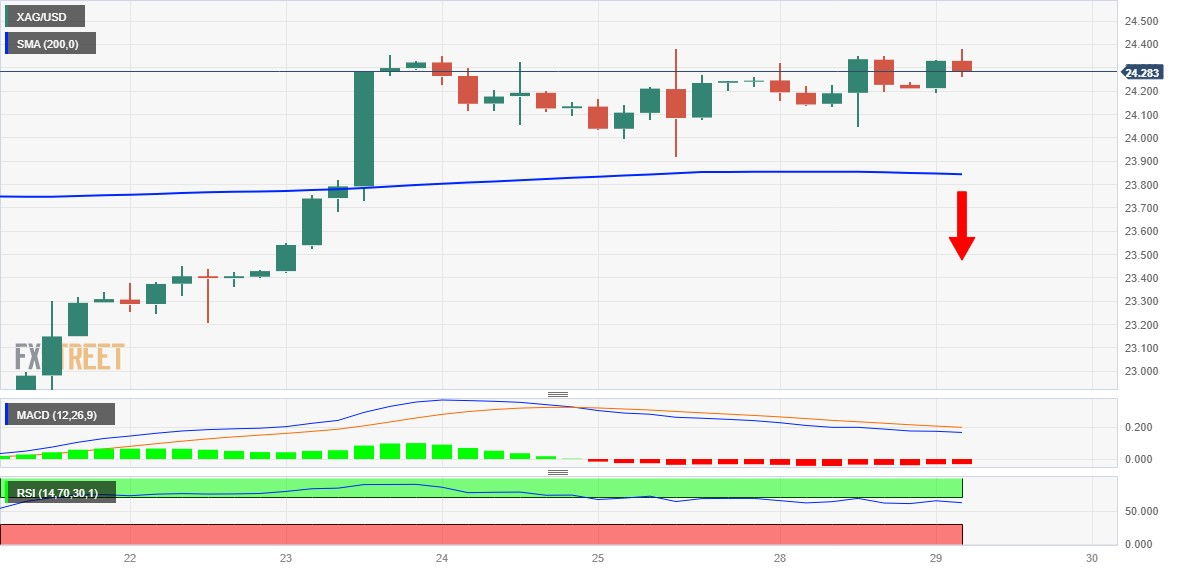
On the flip side, the $24.00 mark is likely to protect the immediate downside ahead of the 200-period Simple Moving Average (SMA) on the 4-hour chart, currently pegged around the $23.85 region. A sustained break below might prompt some technical selling and drag the XAG/USD towards the $23.55 region. This is closely followed by support near the $23.40 area, representing the 200-day SMA, which if broken decisively might shift the near-term bias in favour of bearish traders and pave the way for a further downside towards testing sub-$23.00 levels.

Silver 4-hour chart

fxsoriginal

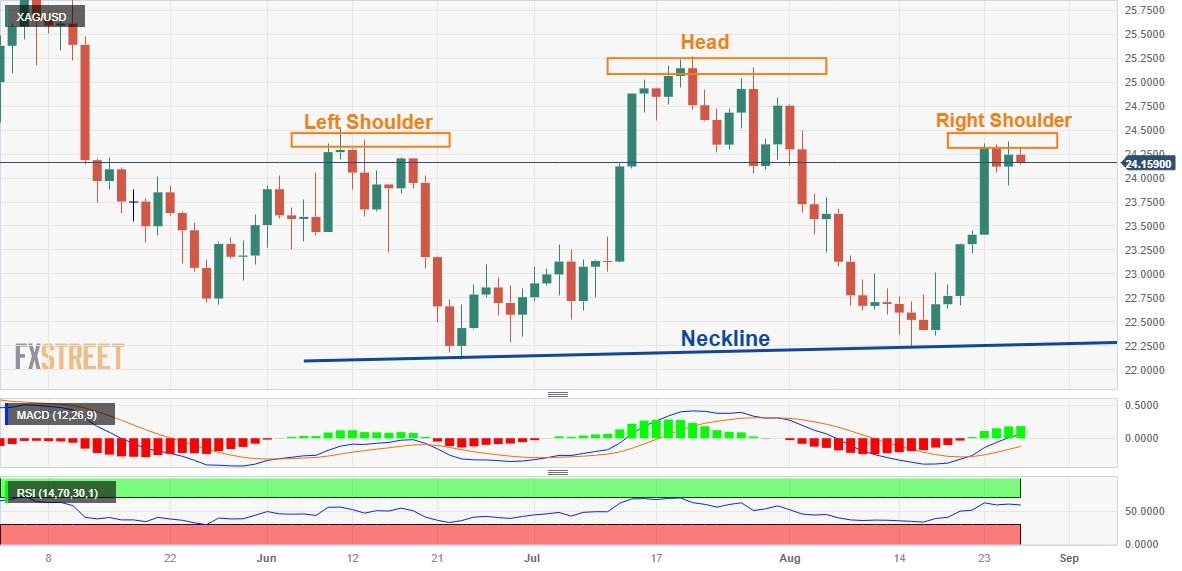
Any subsequent decline will expose the $22.20-$22.10 support zone. The latter represents the neckline of a bearish head and shoulders pattern formation on the daily chart. Hence, a convincing break below will set the stage for a meaningful decline.

XAG/USD daily chart

fxsoriginal

Technical levels to watch

XAG/USD

Overview
Today last price24.28
Today Daily Change0.05
Today Daily Change %0.21
Today daily open24.23
 
Trends
Daily SMA2023.29
Daily SMA5023.53
Daily SMA10023.97
Daily SMA20023.37
 
Levels
Previous Daily High24.36
Previous Daily Low24.05
Previous Weekly High24.38
Previous Weekly Low22.67
Previous Monthly High25.27
Previous Monthly Low22.52
Daily Fibonacci 38.2%24.17
Daily Fibonacci 61.8%24.24
Daily Pivot Point S124.07
Daily Pivot Point S223.9
Daily Pivot Point S323.76
Daily Pivot Point R124.38
Daily Pivot Point R224.52
Daily Pivot Point R324.68

Author

Haresh Menghani

Haresh Menghani is a detail-oriented professional with 10+ years of extensive experience in analysing the global financial markets.

More from Haresh Menghani
Share:

Markets move fast. We move first.

Orange Juice Newsletter brings you expert driven insights - not headlines. Every day on your inbox.

By subscribing you agree to our Terms and conditions.

Editor's Picks

EUR/USD clings to small gains near 1.1750

Following a short-lasting correction in the early European session, EUR/USD regains its traction and clings to moderate gains at around 1.1750 on Monday. Nevertheless, the pair's volatility remains low, with investors awaiting this weeks key data releases from the US and the ECB policy announcements.

GBP/USD edges higher toward 1.3400 ahead of US data and BoE

GBP/USD reverses its direction and advances toward 1.3400 following a drop to the 1.3350 area earlier in the day. The US Dollar struggles to gather recovery momentum as markets await Tuesday's Nonfarm Payrolls data, while the Pound Sterling holds steady ahead of the BoE policy announcements later in the week.

Gold stuck around $4,300 as markets turn cautious

Gold loses its bullish momentum and retreats below $4,350 after testing this level earlier on Monday. XAU/USD, however, stays in positive territory as the US Dollar remains on the back foot on growing expectations for a dovish Fed policy outlook next year.

Solana consolidates as spot ETF inflows near $1 billion signal institutional dip-buying

Solana price hovers above $131 at the time of writing on Monday, nearing the upper boundary of a falling wedge pattern, awaiting a decisive breakout. On the institutional side, demand for spot Solana Exchange-Traded Funds remained firm, pushing total assets under management to nearly $1 billion since launch. 

Big week ends with big doubts

The S&P 500 continued to push higher yesterday as the US 2-year yield wavered around the 3.50% mark following a Federal Reserve (Fed) rate cut earlier this week that was ultimately perceived as not that hawkish after all. The cut is especially boosting the non-tech pockets of the market.

Solana Price Forecast: SOL consolidates as spot ETF inflows near $1 billion signal institutional dip-buying

Solana (SOL) price hovers above $131 at the time of writing on Monday, nearing the upper boundary of a falling wedge pattern, awaiting a decisive breakout.