|

Silver Price Analysis: XAG/USD sits near 10-week peak, bulls await a move beyond $24.00

  • Silver attracts some buyers for the fifth successive day on Friday.
  • The overnight breakout through the $23.60-70 area favours bulls.
  • Corrective declines are likely to get bought into and remain limited.

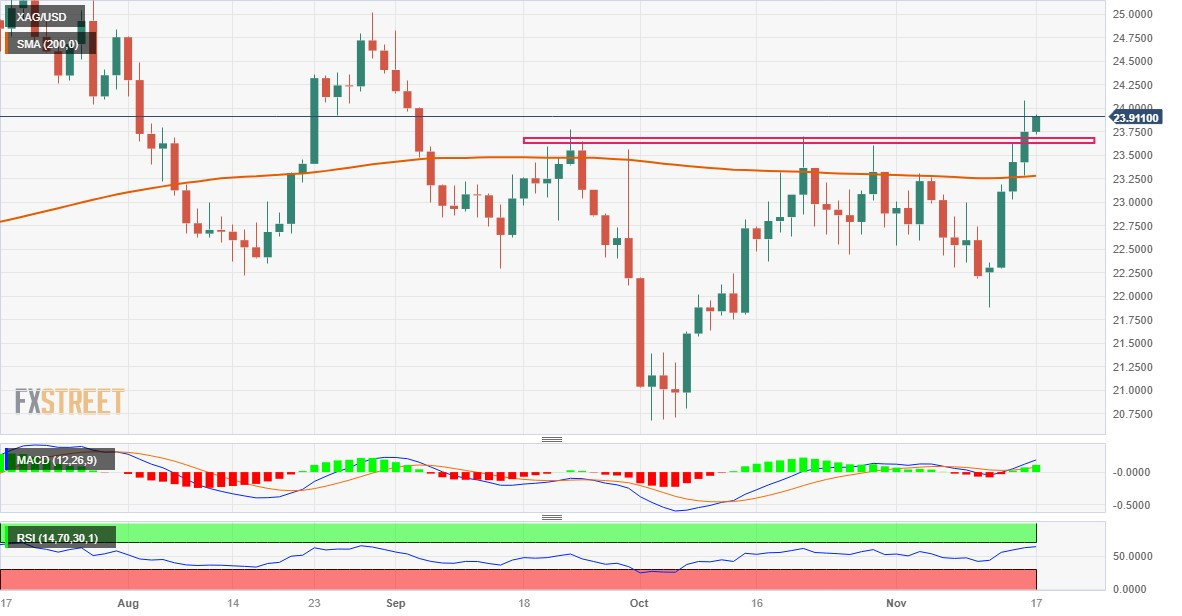
Silver (XAG/USD) gains positive traction for the fifth successive day on Friday and remains well within the striking distance of its highest level since September 4 touched the previous day. The white metal currently trades just below the $24.00 mark and seems poised to build on this week's solid bounce from a four-week trough.

From a technical perspective, acceptance above the very important 200-day Simple Moving Average (SMA) and the overnight breakout through the $23.60-$23.70 supply zone was seen as a fresh trigger for bullish traders. Moreover, oscillators on the daily chart have been gaining positive traction and validate the near-term positive outlook, suggesting that the path of least resistance for the XAG/USD is to the upside.

Some follow-through buying beyond the $24.00 round figure will reaffirm the constructive setup and the white metal to the $24.20-$24.25 intermediate resistance. The momentum could get extended and allow the XAG/USD to make a fresh attempt towards conquering the $25.00 psychological mark. Nevertheless, Silver remains on track to register strong weekly gains and post its highest weekly close since late August.

On the flip side, the $23.70-$23.60 strong resistance breakpoint now seems to protect the immediate downside ahead of the 200-day SMA, currently pegged near the $23.30 region. Any further decline might now attract fresh buyers and remain limited near the $23.00 mark. The latter should act as a key pivotal point, which if broken could drag the XAG/USD to the $22.35-$22.30 zone en route to the $22.00 mark.

A convincing break below the latter might shift the near-term bias back in favour of bearish traders. Some follow-through selling below the $21.85 region, or the monthly low, could make the XAG/USD vulnerable to accelerate the fall towards the $21.35-$21.30 region. The white metal could eventually weaken further below the $21.00 mark and test a multi-month low, around the $20.70-$20.65 area touched in October.

Silver daily chart
fxsoriginal

Technical levels to watch

XAG/USD

Overview
Today last price23.9
Today Daily Change0.15
Today Daily Change %0.63
Today daily open23.75
 
Trends
Daily SMA2022.94
Daily SMA5022.68
Daily SMA10023.21
Daily SMA20023.27
 
Levels
Previous Daily High24.08
Previous Daily Low23.28
Previous Weekly High23.26
Previous Weekly Low22.19
Previous Monthly High23.7
Previous Monthly Low20.68
Daily Fibonacci 38.2%23.78
Daily Fibonacci 61.8%23.59
Daily Pivot Point S123.33
Daily Pivot Point S222.91
Daily Pivot Point S322.53
Daily Pivot Point R124.13
Daily Pivot Point R224.5
Daily Pivot Point R324.92

Author

Haresh Menghani

Haresh Menghani is a detail-oriented professional with 10+ years of extensive experience in analysing the global financial markets.


More from Haresh Menghani
Share:

Editor's Picks

GBP/USD stays below 1.3400 after soft UK CPI data

GBP/USD struggles to gain traction and stays below 1.3400 in the second half of the day on Wednesday. The UK annual Consumer Price Index (CPI) inflation cooled to 2.6% in June against the market forecast of 2.7%, making it difficult for the British Pound gather recovery momentum. Meanwhile, investors keep a close eye on headlines coming out of the Middle East.

EUR/USD stabilizes near 1.1400 as markets focus on geopolitics

EUR/USD trades in a narrow channel at around 1.1400 on Wednesday. In the absence of high-impact data releases, escalating geopolitical tensions in the Middle East caps the pair's upside. On Thursday, the European Central Bank (ECB) will announce monetary policy decisions.

Gold holds gains above $4,100 undaunted by risk-off markets

Gold extends gains for the fourth consecutive day, standing comfortably above $4,100, unfazed by the risk-off market amid rising tensions in Iran and higher Oil prices. The pair has rallied nearly 2.5% so far this week and is on track for its best weekly performance in more than three months.

XRP consolidates as inflows and volume climb
Ripple (XRP) retains a slightly bullish outlook on Wednesday despite logging a minor correction from the supply range near $1.15. The remittance token is down 0.5% on the day, reflecting a broader cryptocurrency market drawdown, primarily driven by persistent geopolitical tensions between the United States (US) and Iran in the Middle East.
US – Fed preview: A divided hold
The first month after Kevin Warsh's debut at the FOMC's June meeting has brought mixed signals on the inflation front. On one hand, the re-escalation of the war in Iran has lifted energy prices higher again. Yet on the other hand, Warsh's hawkish comments have already lifted real rates, supported broad USD and tightened financial conditions while realized inflation surprised to the downside in June.
US Dollar mid-year outlook: Exceptional currency, exceptional risks?
The US Dollar enters the second half of 2026 in a markedly different position from a year ago. The King currency has recovered, reflecting persistent US inflation, changing expectations for Fed policy, geopolitical tensions and renewed demand for defensive assets.














