|

Silver Price Analysis: XAG/USD shines above $24.00 fueled by soft US Dollar

  • Silver's nearly 1% gain drives it to around $24.40, as market bets on a June Federal Reserve rate cut.
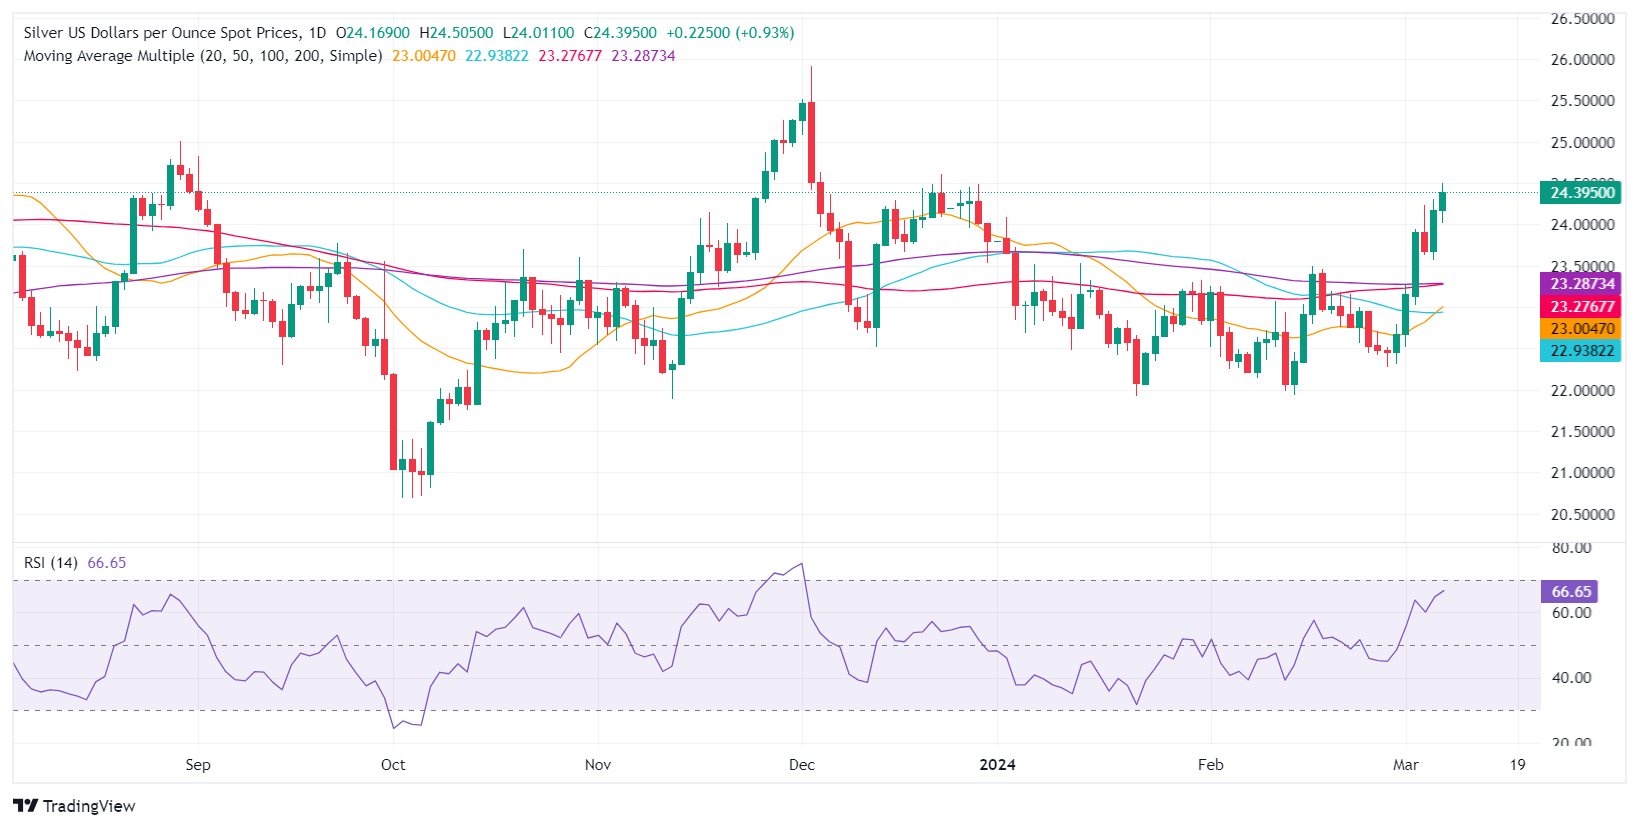
  • Technical indicators bullish as silver surpasses 50, 100, and 200-day DMAs, eyeing December highs.
  • Despite bullish trend, potential pullback risks exist if silver dips below $24.50, with supports at $24.00 and $23.57.

Silver price advances during Thursday’s session, gains almost 1% and stays above the $24.00 figure as investors expect a rate cut by the Federal Reserve in June. Therefore, XAG/USD exchanges hands at $24.40.

XAG/USD Price Analysis: Technical outlook

After bottoming at around $22.50, the grey metal extended its gains due to fundamental news. That opened the door to clear key resistance levels seen at the 50, 100, and 200-day moving averages (DMAs). If buyers push prices above the December 28 high of $24.48, look for a leg-up toward the December 22 peak at $24.60, ahead of the $25.00 psychological figure.

On a bearish scenario, the less likely as Relative Strength Index (RSI) studies show bullish momentum, XAG/USD’s daily close below $24.50, could sponsor a pullback. The first support would be the $24.00, followed by the March 6 low of $23.57,

XAG/USD Price Action – Daily Chart

XAG/USD

Overview
Today last price24.39
Today Daily Change0.22
Today Daily Change %0.91
Today daily open24.17
 
Trends
Daily SMA2022.91
Daily SMA5022.93
Daily SMA10023.26
Daily SMA20023.28
 
Levels
Previous Daily High24.3
Previous Daily Low23.57
Previous Weekly High23.27
Previous Weekly Low22.28
Previous Monthly High23.5
Previous Monthly Low21.93
Daily Fibonacci 38.2%24.03
Daily Fibonacci 61.8%23.85
Daily Pivot Point S123.73
Daily Pivot Point S223.28
Daily Pivot Point S323
Daily Pivot Point R124.46
Daily Pivot Point R224.75
Daily Pivot Point R325.19

Author

Christian Borjon Valencia

Markets analyst, news editor, and trading instructor with over 14 years of experience across FX, commodities, US equity indices, and global macro markets.

More from Christian Borjon Valencia
Share:

Editor's Picks

AUD/USD eyes 0.7150 barrier nine-day EMA

AUD/USD inches higher after registering modest losses in the previous day, trading around 0.7130 during the Asian hours. The technical analysis of the daily chart indicates that the pair is moving sideways within the rectangle pattern, suggesting a consolidation as neither the bulls nor the bears have enough momentum to take control of the market.

USD/JPY trades below 160.00 intervention threshold; bullish bias intact

The USD/JPY pair attracts some sellers during the Asian session amid fears that authorities will step in again to prop up the Japanese Yen. Furthermore, the Israel-Lebanon truce prompts some profit-taking around the US Dollar and exerts downward pressure on the currency pair.

Gold rebounds from one-week low as Israel-Lebanon truce pressures safe-haven USD

Gold gains some positive traction on Thursday and climbs to the $4,475 area during the Asian session, reversing a major part of the previous day's slide to a one-week low. The Israel-Lebanon truce prompts some profit-taking around the US Dollar and supports the commodity. 


Hyperliquid: ETF demand, capital rotation fuel HYPE rally as Bitcoin melts

Hyperliquid price sustains an upward trend near its all-time high of $75.76 on Thursday after posting 80% gains in May, while Bitcoin (BTC) retraces below $65,000, triggering a market-wide panic.

Kevin Warsh takes the Fed helm: What it means for the US Dollar
The Federal Reserve moves away from the highly predictable "forward guidance" model of the Jerome Powell era to a new “Kevin Warsh environment”, characterized by less communication, more policy surprises, and an increased focus on the Fed's complex balance sheet.
Recession on paper: What really moves the Canadian Loonie now?

Statistics Canada handed the headline writers a gift and the analysts a headache. Real GDP shrank 0.1% on an annualized basis in the first quarter, and with the fourth quarter of 2025 revised down to a 1.0% contraction, that is two negative quarters in a row, the textbook definition of a technical recession and Canada's first since the pandemic.