Silver Price Analysis: XAG/USD seems vulnerable to slide further below $31.00 mark
- Silver continues losing ground for the second straight day and drops to a one-month low.
- The technical setup favors bearish traders and supports prospects for additional losses.
- Any attempted recovery might now be seen as a selling opportunity and remain capped.

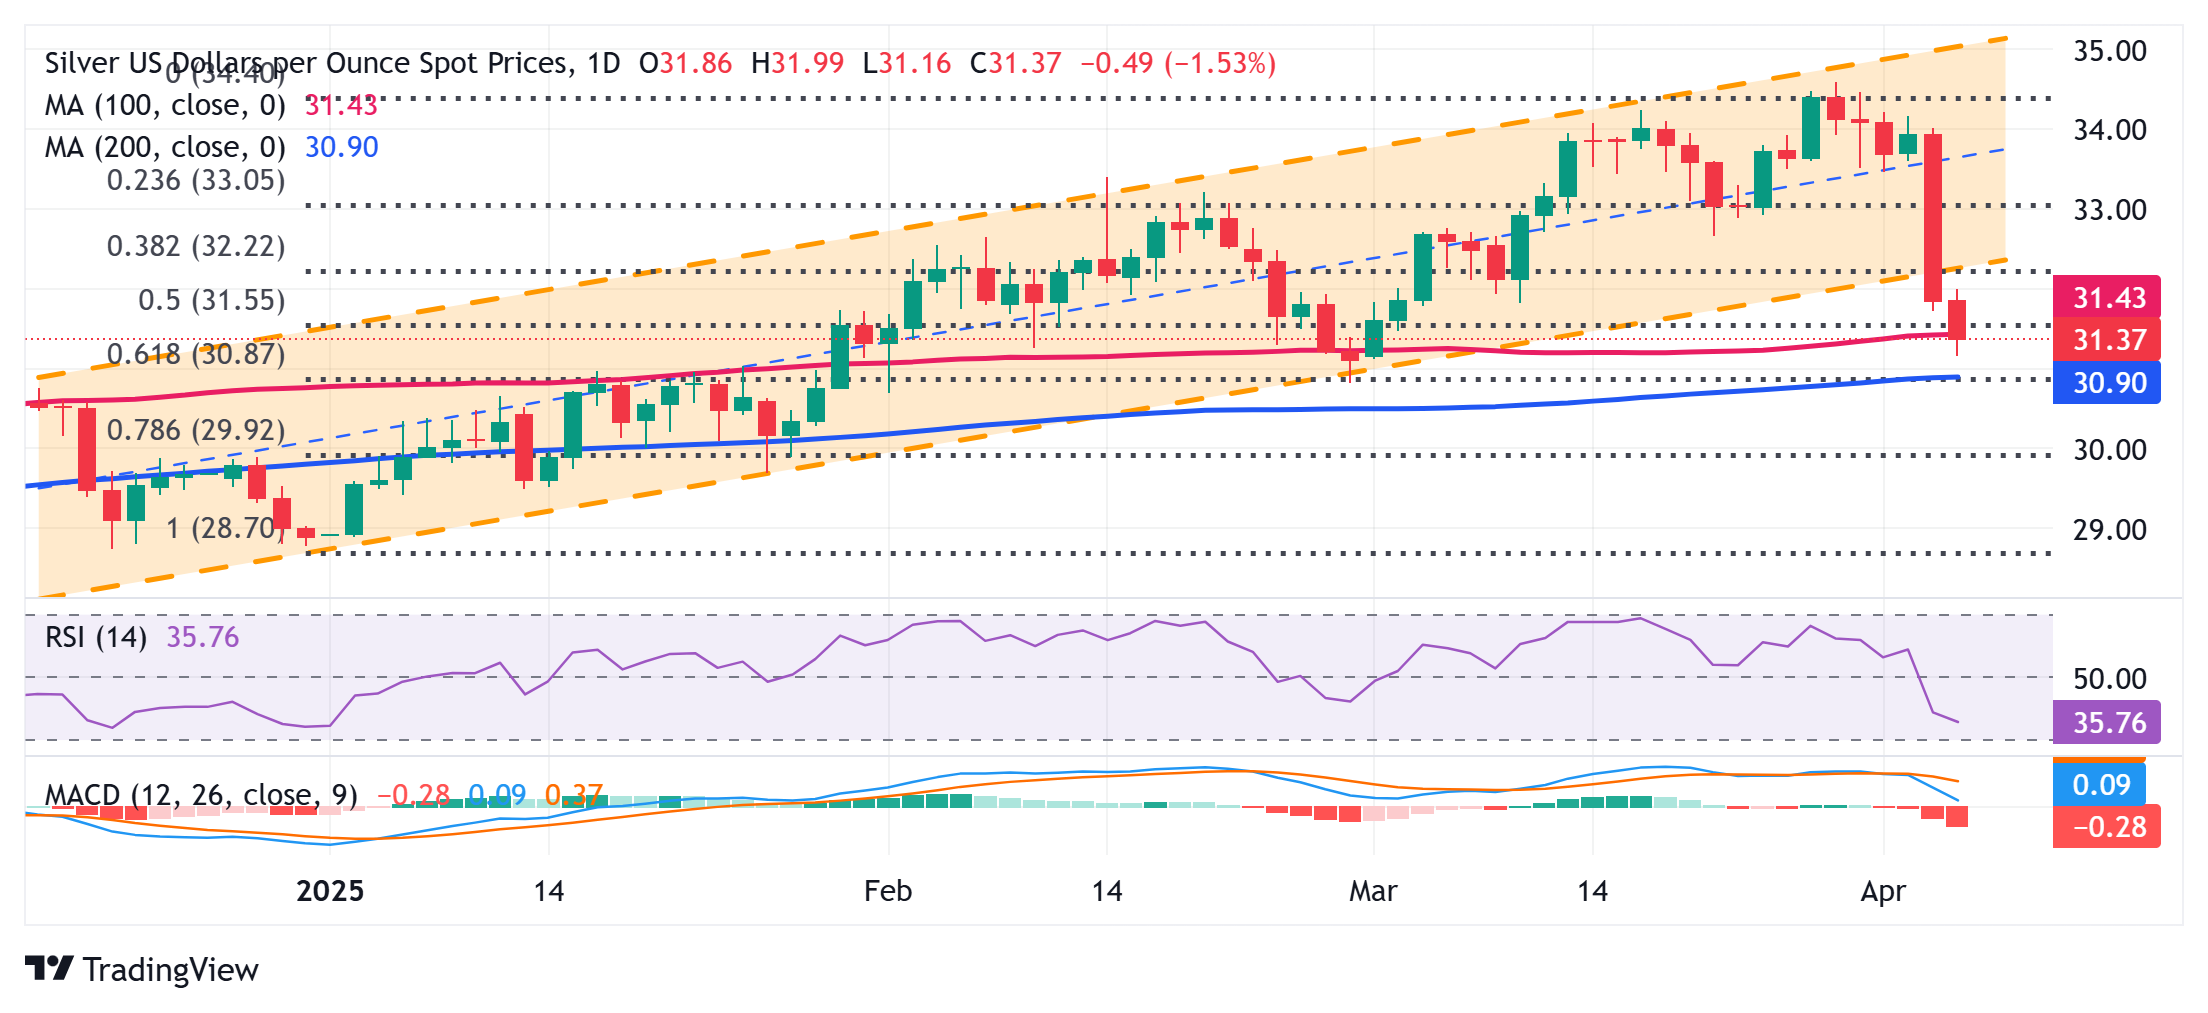
Silver (XAG/USD) adds to the previous day's heavy losses and attracts some follow-through selling for the second successive day on Friday. This also marks the fifth day of a negative move in the previous six and drags the white metal to a one-month low, around the $31.15 region during the first half of the European session.
With the latest leg down, the XAG/USD confirms a breakdown through a multi-month-old ascending channel and now seems to have found acceptance below the 50% Fibonacci retracement level of the December-March move-up. Furthermore, oscillators on the daily chart are holding deep in negative territory and are still away from being in the oversold zone, suggesting that the path of least resistance for the white metal is to the downside.
Hence, a subsequent fall towards testing sub-$31.00 levels, or confluence support comprising the 200-day Simple Moving Average (SMA) and the 61.8% Fbo. level, looks likely a distinct possibility. A convincing break below the said support will be seen as a fresh trigger for bearish traders. This would pave the way for an extension of the recent sharp retracement slide from the $34.55-$34.60 region, or the year-to-date high touched on March 28.
On the flip side, any recovery above the 50% Fibo. level, around the $31.65-$31.70 region, could be seen as a selling opportunity and remain capped near the $32.00 round-figure mark, or the ascending channel support breakpoint. However, some follow-through buying, leading to a further move up beyond the $32.30-$32.35 region (38.2% Fibo. level), might prompt a short-covering rally and allow the XAG/USD to reclaim the $33.00 mark.
Silver daily chart
Silver FAQs
Silver is a precious metal highly traded among investors. It has been historically used as a store of value and a medium of exchange. Although less popular than Gold, traders may turn to Silver to diversify their investment portfolio, for its intrinsic value or as a potential hedge during high-inflation periods. Investors can buy physical Silver, in coins or in bars, or trade it through vehicles such as Exchange Traded Funds, which track its price on international markets.
Silver prices can move due to a wide range of factors. Geopolitical instability or fears of a deep recession can make Silver price escalate due to its safe-haven status, although to a lesser extent than Gold's. As a yieldless asset, Silver tends to rise with lower interest rates. Its moves also depend on how the US Dollar (USD) behaves as the asset is priced in dollars (XAG/USD). A strong Dollar tends to keep the price of Silver at bay, whereas a weaker Dollar is likely to propel prices up. Other factors such as investment demand, mining supply – Silver is much more abundant than Gold – and recycling rates can also affect prices.
Silver is widely used in industry, particularly in sectors such as electronics or solar energy, as it has one of the highest electric conductivity of all metals – more than Copper and Gold. A surge in demand can increase prices, while a decline tends to lower them. Dynamics in the US, Chinese and Indian economies can also contribute to price swings: for the US and particularly China, their big industrial sectors use Silver in various processes; in India, consumers’ demand for the precious metal for jewellery also plays a key role in setting prices.
Silver prices tend to follow Gold's moves. When Gold prices rise, Silver typically follows suit, as their status as safe-haven assets is similar. The Gold/Silver ratio, which shows the number of ounces of Silver needed to equal the value of one ounce of Gold, may help to determine the relative valuation between both metals. Some investors may consider a high ratio as an indicator that Silver is undervalued, or Gold is overvalued. On the contrary, a low ratio might suggest that Gold is undervalued relative to Silver.
BRANDED CONTENT
Choosing a broker that aligns with your trading needs can significantly impact performance. Our list of the best regulated brokers highlights the best options for seamless and cost-effective trading.
Author

Haresh Menghani
FXStreet
Haresh Menghani is a detail-oriented professional with 10+ years of extensive experience in analysing the global financial markets.


