|

Silver Price Analysis: XAG/USD seems vulnerable, short-term trading range breakdown in play

  • Silver registers a modest recovery from a nearly one-month low and snaps a two-day losing streak.
  • Oversold RSI (14) on hourly charts helps the XAG/USD to find support near the 23.6% Fibo. level.
  • The technical setup, however, favours bearish traders and supports prospects for additional losses.

Silver stages a modest intraday recovery from a nearly one-month low, around the $22.20-$22.15 region touched earlier this Monday and reverses a part of Friday's heavy losses. The white metal, for now, seems to have snapped a two-day losing streak, though the near-term technical setup seems tilted firmly in favour of bearish traders.

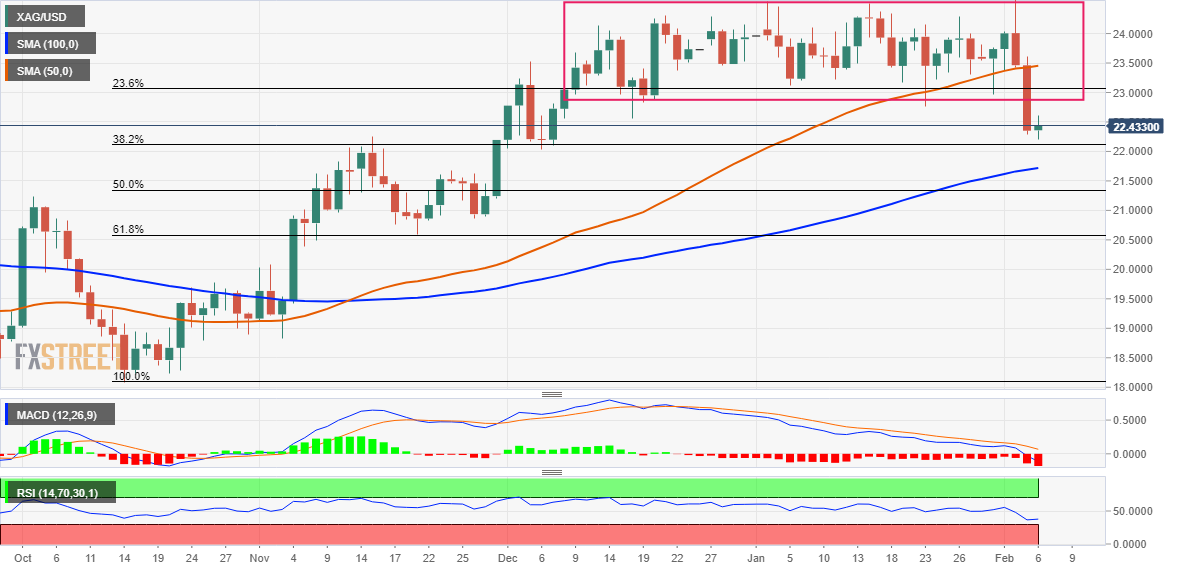
The steep decline witnessed over the past two trading sessions confirmed a near-term breakdown through the $23.00-$22.90 strong horizontal support. The said area marked the lower end of a nearly two-month-old trading range and coincided with the 23.6% Fibonacci retracement level of the recent rally from October 2022. Furthermore, acceptance below the 50-day SMA adds credence to the negative outlook for the XAG/USD.

That said, the oversold RSI (14) on hourly charts assists the XAG/USD to find support near the 38.2% Fibo. level and stall its sharp pullback from the highest level since April 2022 touched last week. Hence, it will be prudent to wait for some follow-through selling below the $22.20-$22.15 area before positioning for a fall below the $22.00 mark, towards the next relevant support near the 100-day SMA, around the $21.60-$21.55 zone.

On the flip side, the aforementioned confluence support breakpoint near the $23.00-$22.90 region now seems to act as an immediate strong barrier. Any subsequent move up might now be seen as a selling opportunity and runs the risk of fizzling out near the 50-day SMA, currently around the $23.30-$23.35 region. That said, a sustained strength beyond will negate the bearish bias and prompt some short-covering around the XAG/USD.

Silver daily chart

fxsoriginal

Key levels to watch

XAG/USD

Overview
Today last price22.43
Today Daily Change0.08
Today Daily Change %0.36
Today daily open22.35
 
Trends
Daily SMA2023.69
Daily SMA5023.42
Daily SMA10021.69
Daily SMA20021.02
 
Levels
Previous Daily High23.61
Previous Daily Low22.29
Previous Weekly High24.64
Previous Weekly Low22.29
Previous Monthly High24.55
Previous Monthly Low22.76
Daily Fibonacci 38.2%22.79
Daily Fibonacci 61.8%23.1
Daily Pivot Point S121.89
Daily Pivot Point S221.43
Daily Pivot Point S320.58
Daily Pivot Point R123.21
Daily Pivot Point R224.06
Daily Pivot Point R324.52

Author

Haresh Menghani

Haresh Menghani is a detail-oriented professional with 10+ years of extensive experience in analysing the global financial markets.

More from Haresh Menghani
Share:

Markets move fast. We move first.

Orange Juice Newsletter brings you expert driven insights - not headlines. Every day on your inbox.

By subscribing you agree to our Terms and conditions.

Editor's Picks

EUR/USD eases toward 1.1700 as USD finds fresh demand

EUR/USD eases toward the 1.1700 mark in early Europe on Friday. The pair faces headwinds from a renewed uptick in the US Dollar as investors look past softer US inflation data. However, the EUR/USD downside appears capped by expectations of Fed-ECB monetary policy divergence. 

GBP/USD steadies below 1.3400 as traders digest BoE policy update and US inflation data

The GBP/USD pair stalls the previous day's pullback from the vicinity of mid-1.3400s and a nearly two-month high, though it struggles to attract meaningful buyers during the Asian session on Friday. Spot prices currently trade around the 1.3380-1.3385 region, up only 0.05% for the day, amid mixed cues.

Gold seems vulnerable as USD bulls shrug off softer US CPI

Gold extends the previous day's late pullback from the vicinity of the record high and attracts some follow-through selling during the Asian session on Friday. The US CPI report released on Thursday pointed to cooling of inflationary pressure.

Bitcoin, Ethereum and Ripple correction slide as BoJ rate decision weighs on sentiment

Bitcoin, Ethereum, and Ripple are extending their correction phases after losing nearly 3%, 8%, and 10%, respectively, through Friday. The pullback phase is further strengthened as the upcoming Bank of Japan’s rate decision on Friday weighs on risk sentiment, with BTC breaking key support, ETH deepening weekly losses, and XRP sliding to multi-month lows.

Bank of England cuts rates in heavily divided decision

The Bank of England has cut rates to 3.75%, but the decision was more hawkish than expected, leaving market rates higher and sterling slightly stronger. It's a close call whether the Bank cuts again in February or March.

Ethereum Price Forecast: EF outlines ways to solve growing state issues

Ethereum price today: $2,920. The EF noted that Ethereum's growing state could lead to centralization and weaken censorship resistance. The Stateless Consensus team outlined state expiry, state archive and partial statelessness as potential solutions to the growing state load.