|

Silver Price Analysis: XAG/USD rises to highs not seen since May after soft PPI figures from the US

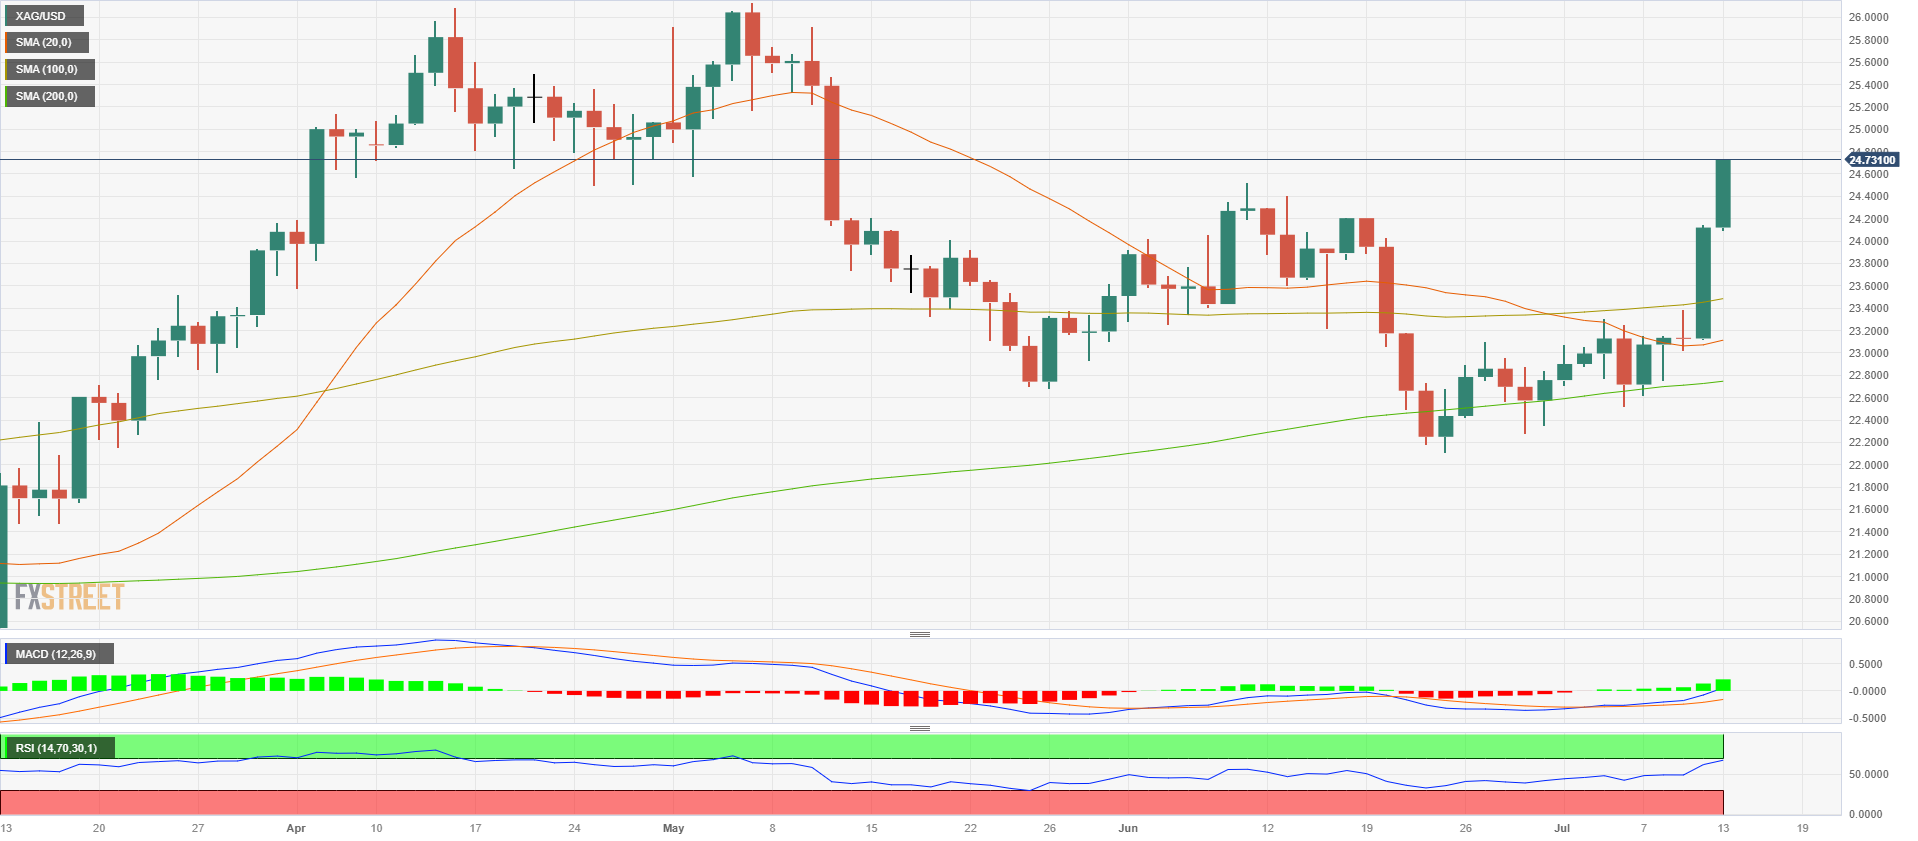
  • The XAG/USD records more than 2% gains on the day, jumping to the $24.70 area.
  • Following soft CPI figures on Wednesday, weak PPI on Thursday applied further pressure on the US Dollar.
  • Falling US Treasury yields and dovish bets on the Fed allowed precious metals to advance.

The XAG/USD recorded a fifth consecutive day of gains and jumped to its highest level since mid-May towards the $24.70 area. In that sense, following soft Consumer Price Index (CPI) and Produce Price Index (PPI) data from the US, investors refrained from betting on an additional hike from the Federal Reserve (Fed) past July which made the US yields decline across the board.

The Producer Price Index (PPI) came in at 0.1% MoM, which waslower than the 0.2% expected, while the Core Figure came in at 2.4% YoY, failing to match the expectations of 2.6%. In addition, US Jobless Claims for the week ending on July 7 decelerated. The number of people filing first-time claims for state unemployment insurance came in at 237K, lower than the consensus of 250K and its previous figure of 249K.

The US Treasury yields, which could be seen as the opportunity cost of holding non-yielding metals, continue to decrease following Wednesday’s soft CPI figures. The 2-year yield fell to 4.86%, the 5-year rate to 4%, and the 10-year yield to 3.80%. The 2-year and 5-year rates are displaying a 6% decline on the week, and the 10-year nearly a 3% fall, allowing the XAG/USD to advance. 

According to the CME FedWatch tool, investors continue to bet on a 25 basis point hike by the Federal Reserve (Fed) in July.  The falling yields reflect the decline in the odds of an additional hike following July which stand near 15% vs 40% at the start of the week.

XAG/USD Levels to watch

The daily chart suggests a (very) bullish outlook for the grey metal for the short term. The price trades above its main Simple Moving Averages (SMAs) of 20, 100 and 200 days while technical indicators hint at a strong bullish momentum. In that sense, the Relative Strength Index (RSI) points north near overbought conditions while the Moving Average Convergence Divergence (MACD) prints rising green bars.

Resistance Levels: $25.00, $25.30, $25.60.
Support Levels: $24.05, $23.50 (100-day SMA), $23.10 (20-day SMA),.
XAG/USD

Overview
Today last price24.73
Today Daily Change0.61
Today Daily Change %2.53
Today daily open24.12
 
Trends
Daily SMA2023.07
Daily SMA5023.63
Daily SMA10023.45
Daily SMA20022.73
 
Levels
Previous Daily High24.15
Previous Daily Low23.12
Previous Weekly High23.31
Previous Weekly Low22.52
Previous Monthly High24.53
Previous Monthly Low22.11
Daily Fibonacci 38.2%23.76
Daily Fibonacci 61.8%23.51
Daily Pivot Point S123.44
Daily Pivot Point S222.76
Daily Pivot Point S322.41
Daily Pivot Point R124.48
Daily Pivot Point R224.83
Daily Pivot Point R325.51

Author

Patricio Martín

Patricio is an economist from Argentina passionate about global finance and understanding the daily movements of the markets.


More from Patricio Martín
Share:

Editor's Picks

AUD/USD bulls seem hesitant below 0.7050 ahead of RBA on Tuesday

AUD/USD reverses an Asian session dip on Monday as renewed optimism over Iran diplomacy boosts investor confidence, keeping a lid on the safe-haven US Dollar and supporting the risk-sensitive Aussie. Spot prices, however, remain below the one-month high, touched last Thursday, as bulls wait for the crucial RBA decision before taking fresh positions.


USD/JPY climbs to 158.00 neighborhood as BoJ uncertainty weighs on the JPY

The USD/JPY pair gains some positive traction at the start of a new week, recovering further from Friday's post-Bank of Japan (BoJ) swing low to sub-157.00 levels. The momentum lifts spot prices to the 158.00 neighborhood during the Asian session and seems unaffected by fresh intervention warning from Japan's Finance Minister Satsuki Katayama.

Gold recovers on positive US-Iran headlines

Gold extends its recovery during American trading hours on Monday, supported by falling Oil prices following positive headlines on US-Iran talks. The metal regains ground after hitting a fresh yearly low of $3,870 on Friday and ending October down 6.87%. However, the rebound lacks conviction as the fundamental backdrop continues to raise doubts over a sustained recovery.

Bitcoin braces for US midterm elections as historical sell-offs revive downside concerns
Bitcoin (BTC) braces for the impact of the US midterm elections, just a week after the $6 billion hack from Binance. Historically, congressional elections have negatively affected not just the president’s party but also Bitcoin. In the last 22 midterms, the ruling party has gained House seats only twice, while the three most recent elections coincided with Bitcoin’s bear market bottoms.
Why strong US growth could not stop the bond rally and AI selloff

The US economy grew at a 3.4% annual rate, yet Treasury yields fell and the Nasdaq ended October with its worst monthly performance since March 2025. The market is no longer rewarding capital expenditure simply because it supports growth. Investors are testing whether that expenditure can produce cash flow and returns above the cost of capital.


The 2% inflation target came from a throwaway remark. It now moves trillions
The Federal Reserve's 2% inflation goal grew out of an off-the-cuff remark by a New Zealand politician in 1988. Bond investors still price long-term US debt as if 2% holds, so a change in how the Fed measures inflation would move markets.