Silver Price Analysis: XAG/USD reverses from six-week-old hurdle towards $22.00


  • Silver price renews intraday low while taking a U-turn from the highest levels in 1.5 months.
  • Overbought RSI allows XAG/USD sellers to sneak in from six-week-old horizontal resistance.
  • Ascending support line from March 10, 200-EMA put a floor under the Silver price.

Silver price (XAG/USD) takes offers to renew intraday low near $22.40 as it reverses from the highest levels since early February as the Fed week begins.

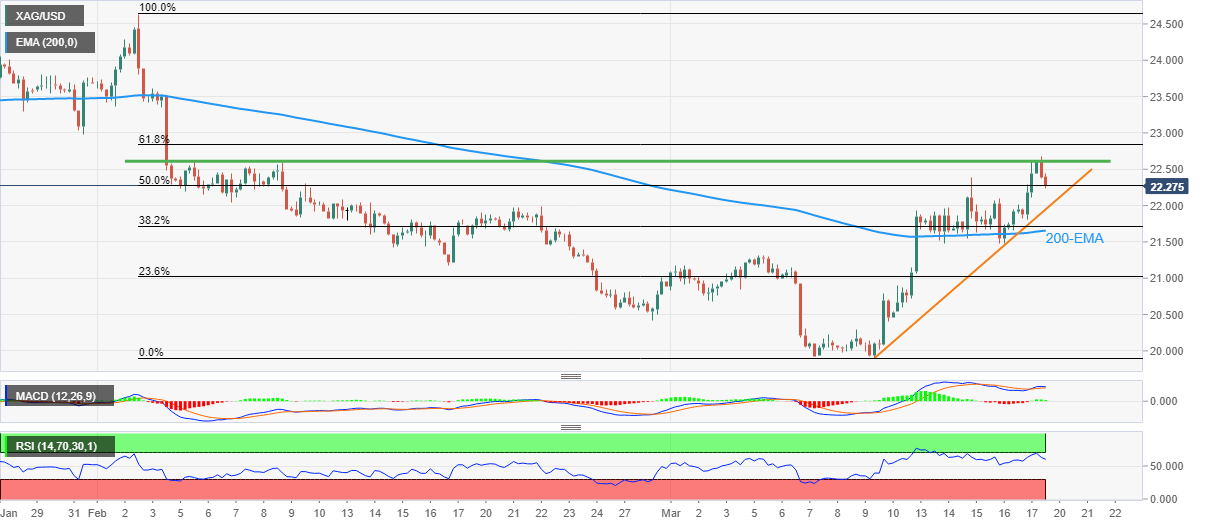
In doing so, the bright metal reverses from the horizontal area comprising multiple tops marked since February 03, around $22.60.

It’s worth noting that the overbought conditions of the RSI (14) also help the XAG/USD to pare recent gains near the multi-day high.

However, bullish MACD signals and the metal’s sustained trading above the key supports keep the Silver buyers hopeful.

Among the immediate crucial support is a one-week-old ascending trend line, around $21.90, as well as the 200-bar Exponential Moving Average (EMA) surrounding $21.65.

It should be observed that the early month swing high near $21.30 and the $21.00 round figure can act as additional downside filters for the XAG/USD bears to watch before targeting the monthly low of $19.90.

Meanwhile, the Silver price run-up beyond the aforementioned resistance line surrounding $22.60 needs validation from the 61.8% Fibonacci retracement level of the metal’s February-March downside, near $22.85.

Following that, a run-up toward the Year-To-Date (YTD) high surrounding $24.65 can’t be ruled out.

Overall, the Silver price is likely to decline but the bears have a long way to ride before retaking control.

Silver price: Four-hour chart

Trend: Further downside expected

Additional important levels

Overview
Today last price 22.33
Today Daily Change -0.28
Today Daily Change % -1.24%
Today daily open 22.61
 
Trends
Daily SMA20 21.16
Daily SMA50 22.33
Daily SMA100 22.32
Daily SMA200 20.94
 
Levels
Previous Daily High 22.61
Previous Daily Low 21.66
Previous Weekly High 22.61
Previous Weekly Low 20.54
Previous Monthly High 24.64
Previous Monthly Low 20.42
Daily Fibonacci 38.2% 22.25
Daily Fibonacci 61.8% 22.03
Daily Pivot Point S1 21.98
Daily Pivot Point S2 21.35
Daily Pivot Point S3 21.03
Daily Pivot Point R1 22.92
Daily Pivot Point R2 23.24
Daily Pivot Point R3 23.87


Share: Feed news

Information on these pages contains forward-looking statements that involve risks and uncertainties. Markets and instruments profiled on this page are for informational purposes only and should not in any way come across as a recommendation to buy or sell in these assets. You should do your own thorough research before making any investment decisions. FXStreet does not in any way guarantee that this information is free from mistakes, errors, or material misstatements. It also does not guarantee that this information is of a timely nature. Investing in Open Markets involves a great deal of risk, including the loss of all or a portion of your investment, as well as emotional distress. All risks, losses and costs associated with investing, including total loss of principal, are your responsibility. The views and opinions expressed in this article are those of the authors and do not necessarily reflect the official policy or position of FXStreet nor its advertisers. The author will not be held responsible for information that is found at the end of links posted on this page.

If not otherwise explicitly mentioned in the body of the article, at the time of writing, the author has no position in any stock mentioned in this article and no business relationship with any company mentioned. The author has not received compensation for writing this article, other than from FXStreet.

FXStreet and the author do not provide personalized recommendations. The author makes no representations as to the accuracy, completeness, or suitability of this information. FXStreet and the author will not be liable for any errors, omissions or any losses, injuries or damages arising from this information and its display or use. Errors and omissions excepted.

The author and FXStreet are not registered investment advisors and nothing in this article is intended to be investment advice.

Recommended content


Recommended content

Editors’ Picks

EUR/USD clings to daily gains above 1.0650

EUR/USD clings to daily gains above 1.0650

EUR/USD gained traction and turned positive on the day above 1.0650. The improvement seen in risk mood following the earlier flight to safety weighs on the US Dollar ahead of the weekend and helps the pair push higher.

EUR/USD News

GBP/USD recovers toward 1.2450 after UK Retail Sales data

GBP/USD recovers toward 1.2450 after UK Retail Sales data

GBP/USD reversed its direction and advanced to the 1.2450 area after touching a fresh multi-month low below 1.2400 in the Asian session. The positive shift seen in risk mood on easing fears over a deepening Iran-Israel conflict supports the pair.

GBP/USD News

Gold holds steady at around $2,380 following earlier spike

Gold holds steady at around $2,380 following earlier spike

Gold stabilized near $2,380 after spiking above $2,400 with the immediate reaction to reports of Israel striking Iran. Meanwhile, the pullback seen in the US Treasury bond yields helps XAU/USD hold its ground.

Gold News

Bitcoin Weekly Forecast: BTC post-halving rally could be partially priced in Premium

Bitcoin Weekly Forecast: BTC post-halving rally could be partially priced in

Bitcoin price shows no signs of directional bias while it holds above  $60,000. The fourth BTC halving is partially priced in, according to Deutsche Bank’s research. 

Read more

Week ahead – US GDP and BoJ decision on top of next week’s agenda

Week ahead – US GDP and BoJ decision on top of next week’s agenda

US GDP, core PCE and PMIs the next tests for the Dollar. Investors await BoJ for guidance about next rate hike. EU and UK PMIs, as well as Australian CPIs also on tap.

Read more

Forex MAJORS

Cryptocurrencies

Signatures