|

Silver Price Analysis: XAG/USD retakes $23.00 mark, not out of the woods yet

  • Silver gains some positive traction and snaps a seven-day losing streak to over a two-week low.
  • The technical setup still favours bears and warrants caution before positioning for further gains.
  • A sustained move beyond the 100-period SMA on the 4-hour chart will negate the bearish bias.

Silver attracts some buying during the Asian session on Friday and for now, seems to have snapped a seven-day losing streak to a two-and-half-week low, around the $22.85 region touched the previous day. The white metal currently trades just above the $23.00 mark, up over 0.40% for the day, though lacks bullish conviction and seems vulnerable to weaken further.

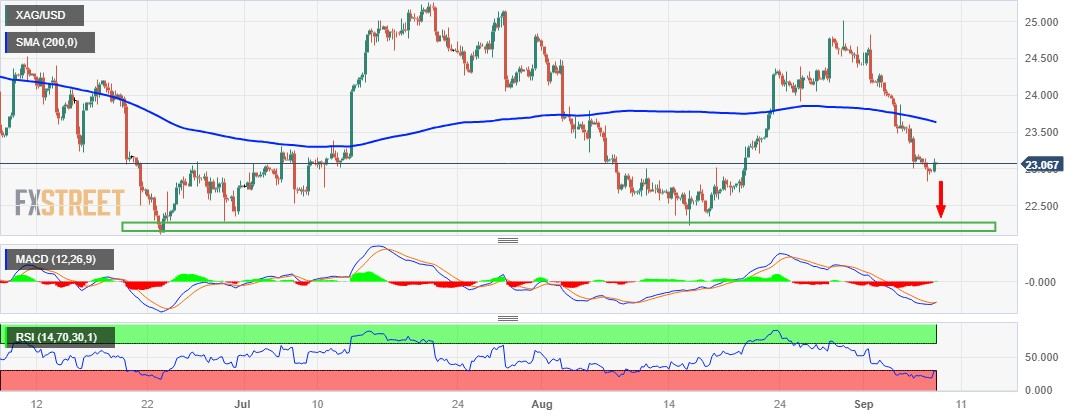
The outlook is reinforced by the fact that technical indicators on the daily chart have just started gaining negative traction, which supports prospects for the emergence of fresh selling at higher levels. Moreover, the Relative Strength Index (RSI) on the 4-hour chart has also recovered from the oversold territory. This, in turn, suggests that the path of least resistance for the XAG/USD is to the downside and any subsequent move up might still be seen as a selling opportunity.

Bearish traders, however, need to wait for some follow-through selling below the overnight swing low, around the $22.85 area, before placing fresh bets. The XAG/USD might then accelerate the downward trajectory below the $22.65-$22.60 support, towards challenging a strong horizontal support near the $22.20-$22.10 zone. This is followed by the $22.00 mark, which if broken will confirm a fresh breakdown and set the stage for an extension of the well-established downtrend.

On the flip side, the $23.35-$23.40 region is likely to act as an immediate hurdle ahead of the $23.65 area, representing the 100-period Simple Moving Average (SMA) on the 4-hour chart, which should act as a pivotal point. A sustained strength beyond will suggests that the recent downfall has run its course and shift the bias in favour of bullish traders. The subsequent short-covering move might then lift the XAG/USD to the $24.00 mark en route to the $24.30-$24.35 supply zone.

Silver 4-hour chart

fxsoriginal

Technical levels to watch

XAG/USD

Overview
Today last price23.06
Today Daily Change0.10
Today Daily Change %0.44
Today daily open22.96
 
Trends
Daily SMA2023.55
Daily SMA5023.74
Daily SMA10023.86
Daily SMA20023.47
 
Levels
Previous Daily High23.19
Previous Daily Low22.83
Previous Weekly High25.02
Previous Weekly Low24.05
Previous Monthly High25.02
Previous Monthly Low22.23
Daily Fibonacci 38.2%22.97
Daily Fibonacci 61.8%23.05
Daily Pivot Point S122.8
Daily Pivot Point S222.64
Daily Pivot Point S322.44
Daily Pivot Point R123.16
Daily Pivot Point R223.35
Daily Pivot Point R323.51

Author

Haresh Menghani

Haresh Menghani is a detail-oriented professional with 10+ years of extensive experience in analysing the global financial markets.

More from Haresh Menghani
Share:

Editor's Picks

EUR/USD flirts with three-day lows near 1.1570

EUR/USD resumes its march south on Thursday, revisting the 1.1570 region, or three-day lows, ahead of the opening bell in Asia. The intense sell-off in the pair comes in response to the solid performance of the US Dollar amid the still unresolved crisis in the Middle East. Moving forward, investors are expected to shift their focus to the release of the US NFP on Friday.
 

GBP/USD stays offered near 1.3340

GBP/USD fades Wednesday’s uptick and trades with decent losses in the 1.3340 zone in the latter part of Thursday’s session. Cable’s weakness, alongside the rest of the risk complex, follows the strong performance of the Greenback amid intense geopolitical jitters.

Gold: further weakness could challenge $5,000

Gold comes under fresh selling pressure on Thursday, slipping back below the $5,100 mark per troy ounce. Persistent strength in the US Dollar (USD) is preventing the yellow metal from building a meaningful recovery, even as markets remain risk-averse amid the deepening conflict in the Middle East.

XRP rises as crypto market steadies despite Middle East war

Ripple (XRP) continues to demonstrate notable resilience as the cryptocurrency market navigates the persistent war in the Middle East after the United States (US) and Israel attacked Iran on Saturday.

Two PMIs, two Chinas

China’s economic data are often treated with a degree of caution by global investors. The challenge is not necessarily that the numbers are incorrect, but that they can describe very different parts of a vast and complex economy. Nowhere is that more evident than in China’s PMIs.

Ripple tests recovery strength amid steady ETF inflows, growing retail interest

Ripple (XRP) continues to demonstrate notable resilience as the cryptocurrency market navigates the persistent war in the Middle East after the United States (US) and Israel attacked Iran on Saturday.