|

Silver Price Analysis: XAG/USD remains vulnerable to retest $22.20-$22.10 horizontal support

  • Silver gains some positive traction on Thursday, albeit lacks bullish conviction.
  • The overnight breakdown through a multi-day-old trading range favours bears.
  • Momentum back above the $23.00 mark could be seen as a selling opportunity.

Silver attracts some buyers during the Asian session on Thursday and reverses a part of the previous day's slide to over a three-week-low, though lacks follow-through and remains below the $23.00 mark.

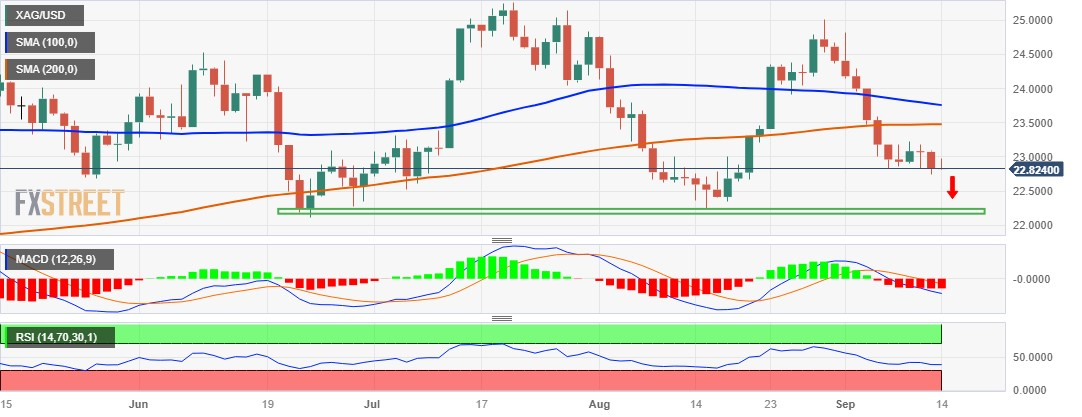
From a technical perspective, the overnight decline below the $22.85-$22.80 horizontal support could be seen as a fresh trigger for bearish traders. Moreover, oscillators on the daily chart are holding in the negative territory and are still far from being in the oversold zone. This, in turn, suggests that the path of least resistance for the XAG/USD is to the downside.

Hence, a subsequent slide back towards testing a strong horizontal support, near the $22.20-$22.10 zone, looks like a distinct possibility. This is followed by the $22.00 round-figure mark, which if broken decisively will pave the way for an extension of a multi-week-old descending trend and drag the XAG/USD to the next relevant support near the $21.25 region.

On the flip side, movement beyond the $23.00 mark now seems to confront stiff resistance near the $23.20 supply zone. Any further move up might be seen as a selling opportunity and remain capped near the 200-day Simple Moving Average (SMA), currently near the $23.45-$23.50 area. This is followed by the 100-day SMA barrier, around the $23.80 region, and the $24.00 mark.

A sustained strength beyond the aforementioned hurdles should negate the near-term negative outlook for the XAG/USD. The subsequent short-covering move has the potential to lift the white metal beyond the $24.30-$24.35 resistance, towards reclaiming the $25.00 psychological mark. The latter represents the August monthly swing high and should act as a pivotal point.

Silver daily chart

fxsoriginal

Technical levels to watch

XAG/USD

Overview
Today last price22.84
Today Daily Change0.00
Today Daily Change %0.00
Today daily open22.84
 
Trends
Daily SMA2023.63
Daily SMA5023.74
Daily SMA10023.78
Daily SMA20023.48
 
Levels
Previous Daily High23.1
Previous Daily Low22.74
Previous Weekly High24.3
Previous Weekly Low22.83
Previous Monthly High25.02
Previous Monthly Low22.23
Daily Fibonacci 38.2%22.88
Daily Fibonacci 61.8%22.96
Daily Pivot Point S122.69
Daily Pivot Point S222.54
Daily Pivot Point S322.34
Daily Pivot Point R123.04
Daily Pivot Point R223.24
Daily Pivot Point R323.39

Author

Haresh Menghani

Haresh Menghani is a detail-oriented professional with 10+ years of extensive experience in analysing the global financial markets.

More from Haresh Menghani
Share:

Markets move fast. We move first.

Orange Juice Newsletter brings you expert driven insights - not headlines. Every day on your inbox.

By subscribing you agree to our Terms and conditions.

Editor's Picks

EUR/USD ticks lower following the release of FOMC Minutes

The US Dollar found some near-term demand following the release of the FOMC meeting minutes, with the EUR/USD pair currently piercing the 1.1750 threshold. The document showed officials are still willing to trim interest rates. Meanwhile, thinned holiday trading keeps major pairs confined to familiar levels.

GBP/USD remains sub- 1.3500, remains in the red

The GBP/USD lost traction early in the American session, maintaining the sour tone and trading around 1.3460 following the release of the FOMC meeting minutes. Trading conditions remain thin ahead of the New Year holiday, limiting the pair's volatility.

Gold stable above $4,350 as the year comes to an end

Gold price got to recover some modest ground on Tuesday, holding on to intraday gains and changing hands at $4,360 a troy ounce in the American afternoon. The bright metal showed no reaction to the release of the FOMC December meeting minutes.

Ethereum: ETH holds above $2,900 despite rising selling activity

Ethereum (ETH) held the $2,900 level despite seeing increased selling pressure over the past week. The Exchange Netflow metric showed deposits outweighed withdrawals by about 400K ETH. The high value suggests rising selling activity amid the holiday season.

Economic outlook 2026-2027 in advanced countries: Solidity test

After a year marked by global economic resilience and ending on a note of optimism, 2026 looks promising and could be a year of solid economic performance. In our baseline scenario, we expect most of the supportive factors at work in 2025 to continue to play a role in 2026.

Crypto market outlook for 2026

Year 2025 was volatile, as crypto often is.  Among positive catalysts were favourable regulatory changes in the U.S., rise of Digital Asset Treasuries (DAT), adoption of AI and tokenization of Real-World-Assets (RWA).