|

Silver Price Analysis: XAG/USD remains confined in a range around $23.00, seems vulnerable

  • Silver attracts some intraday selling on Tuesday, albeit lacks follow-through.
  • The technical setup suggests that the path of least resistance remains down.
  • Attempted recoveries could be seen as a selling opportunity and remain capped.

Silver struggles to capitalize on the previous day's modest recovery gains and attracts fresh sellers in the vicinity of the $23.20 area on Tuesday. The white metal extends its steady descent through the early part of the European session and hits a fresh daily low in the last hour, though shows some resilience below the $23.00 round-figure mark.

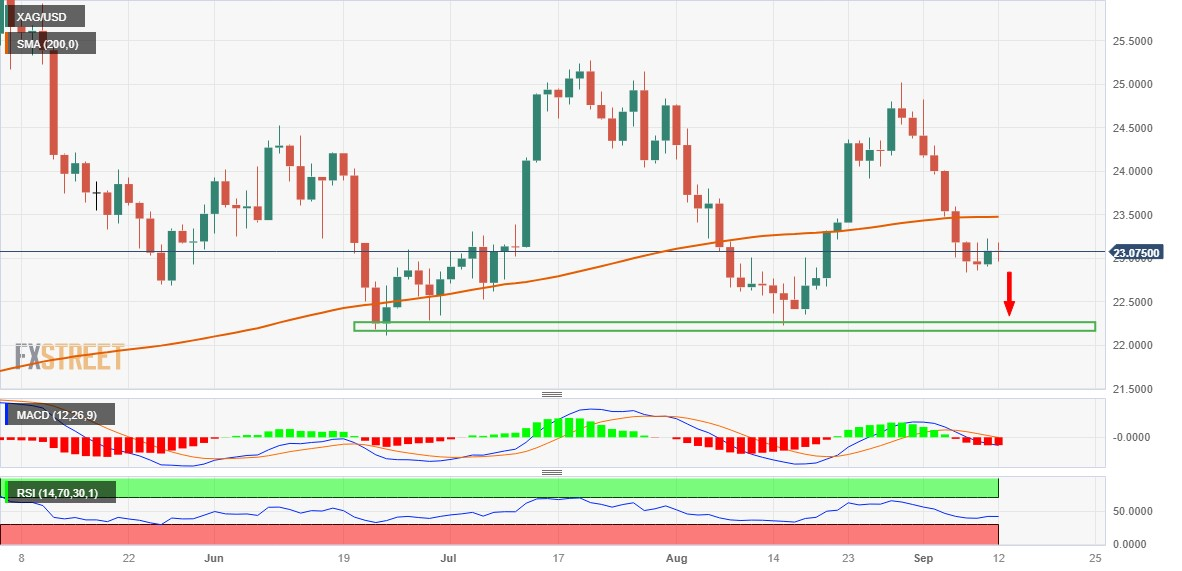
Looking at the broader picture, Silver has been oscillating in a familiar trading back since last Thursday. Against the backdrop of the recent sharp downfall from the $25.00 psychological mark, this range-bound price action might be categorized as a bearish consolidation phase. Moreover, oscillators on the daily chart are holding in the negative territory and are still far from being in the oversold zone. This, in turn, suggests that the path of least resistance for the XAG/USD is to the downside.

Bearish traders, however, might wait for some follow-through selling below the $22.85-$22.80 area or a multi-week low touched last Thursday, before placing fresh bets. The XAG/USD might then accelerate the fall towards challenging a strong horizontal support near the $22.20-$22.10 zone. This is followed by the $22.00 round-figure mark, which if broken decisively will be seen as a fresh trigger for bearish traders and pave the way for an extension of a multi-week-old descending trend.

On the flip side, the $23.20 region now seems to have emerged as an immediate strong resistance. Any subsequent move up might be seen as a selling opportunity and remain capped near the very important 200-day Simple Moving Average (SMA), currently pegged near the $23.45-$23.50 area. This is followed by the 100-day SMA barrier, around the $23.80 region, and the $24.00 mark, which if cleared should negate the near-term negative outlook for the XAG/USD.

The subsequent short-covering move has the potential to lift the white metal beyond the $24.30-$24.35 supply zone, towards reclaiming the $25.00 psychological mark. The latter represents the August monthly swing high and should act as a pivotal point. A sustained strength beyond will be seen as a fresh trigger for bullish traders and pave the way for some meaningful appreciating move for the XAG/USD.

Silver daily chart
fxsoriginal

Technical levels to watch

XAG/USD

Overview
Today last price23.04
Today Daily Change-0.04
Today Daily Change %-0.17
Today daily open23.08
 
Trends
Daily SMA2023.58
Daily SMA5023.74
Daily SMA10023.82
Daily SMA20023.47
 
Levels
Previous Daily High23.22
Previous Daily Low22.91
Previous Weekly High24.3
Previous Weekly Low22.83
Previous Monthly High25.02
Previous Monthly Low22.23
Daily Fibonacci 38.2%23.1
Daily Fibonacci 61.8%23.03
Daily Pivot Point S122.92
Daily Pivot Point S222.75
Daily Pivot Point S322.6
Daily Pivot Point R123.24
Daily Pivot Point R223.39
Daily Pivot Point R323.56

Author

Haresh Menghani

Haresh Menghani is a detail-oriented professional with 10+ years of extensive experience in analysing the global financial markets.


More from Haresh Menghani
Share:

Editor's Picks

AUD/USD meets support around 0.6900

AUD/USD remains well on the defensive, bouncing off three-month lows near the 0.6900 level ahead of the opening bell in Asia on Friday. The pair has accelerated its weekly downtrend in response to the marked advance in the Greenback and the widespread selling pressure on the risk-linked assets.


USD/JPY sits at weekly top above 158.00 as bullish USD counters intervention risks

USD/JPY is sitting at the top end of its weekly range above 158.00 in the Asian session on Thursday. Despite the softer US PCE data, oil-driven inflation risks keep US bond yields elevated near multi-year highs. Moreover, the US-Iran standoff benefits the safe-haven US Dollar and supports the pair. Broad US Dollar strength counters hawkish BoJ expectations and Japanese intervention risks.

Gold alternates gains with losses below $4,200

Gold trades without a clear direction on Thursday, always below the key $4,200 mark per troy ounce. The yellow metal’s vacillating price action comes amid the marked advance in the US Dollar coupled with steady effervescence in the Middle East conflict.

Near Protocol slides below $5.00 after Near Intents $4M exploit
Near Protocol (NEAR) uptrend has been cut short, as the price slides below $5.00 on Thursday. The correction comes after an exploit on the network’s Near Intents services, which affected deposits and withdrawals across 11 crypto networks. NEAR is currently trading at $4.88, below the daily high of $5.54, while falling momentum indicators suggest that sellers are gaining the upper hand.
Markets are pricing a Fed pause. The jobs data says the hike is still coming

The market has rapidly changed its mind about the Fed. Only a week ago, investors saw an October interest-rate hike as the most likely outcome. However, softer inflation and cautious comments from policymakers have since turned a pause into the dominant scenario.

Markets are pricing a Fed pause. The jobs data says the hike is still coming
The market has rapidly changed its mind about the Federal Reserve (Fed). Only a week ago, investors saw an October interest-rate hike as the most likely outcome. However, softer inflation and cautious comments from policymakers have since turned a pause into the dominant scenario. Yet beneath that dramatic repricing, the US economy is sending a considerably less dovish message.