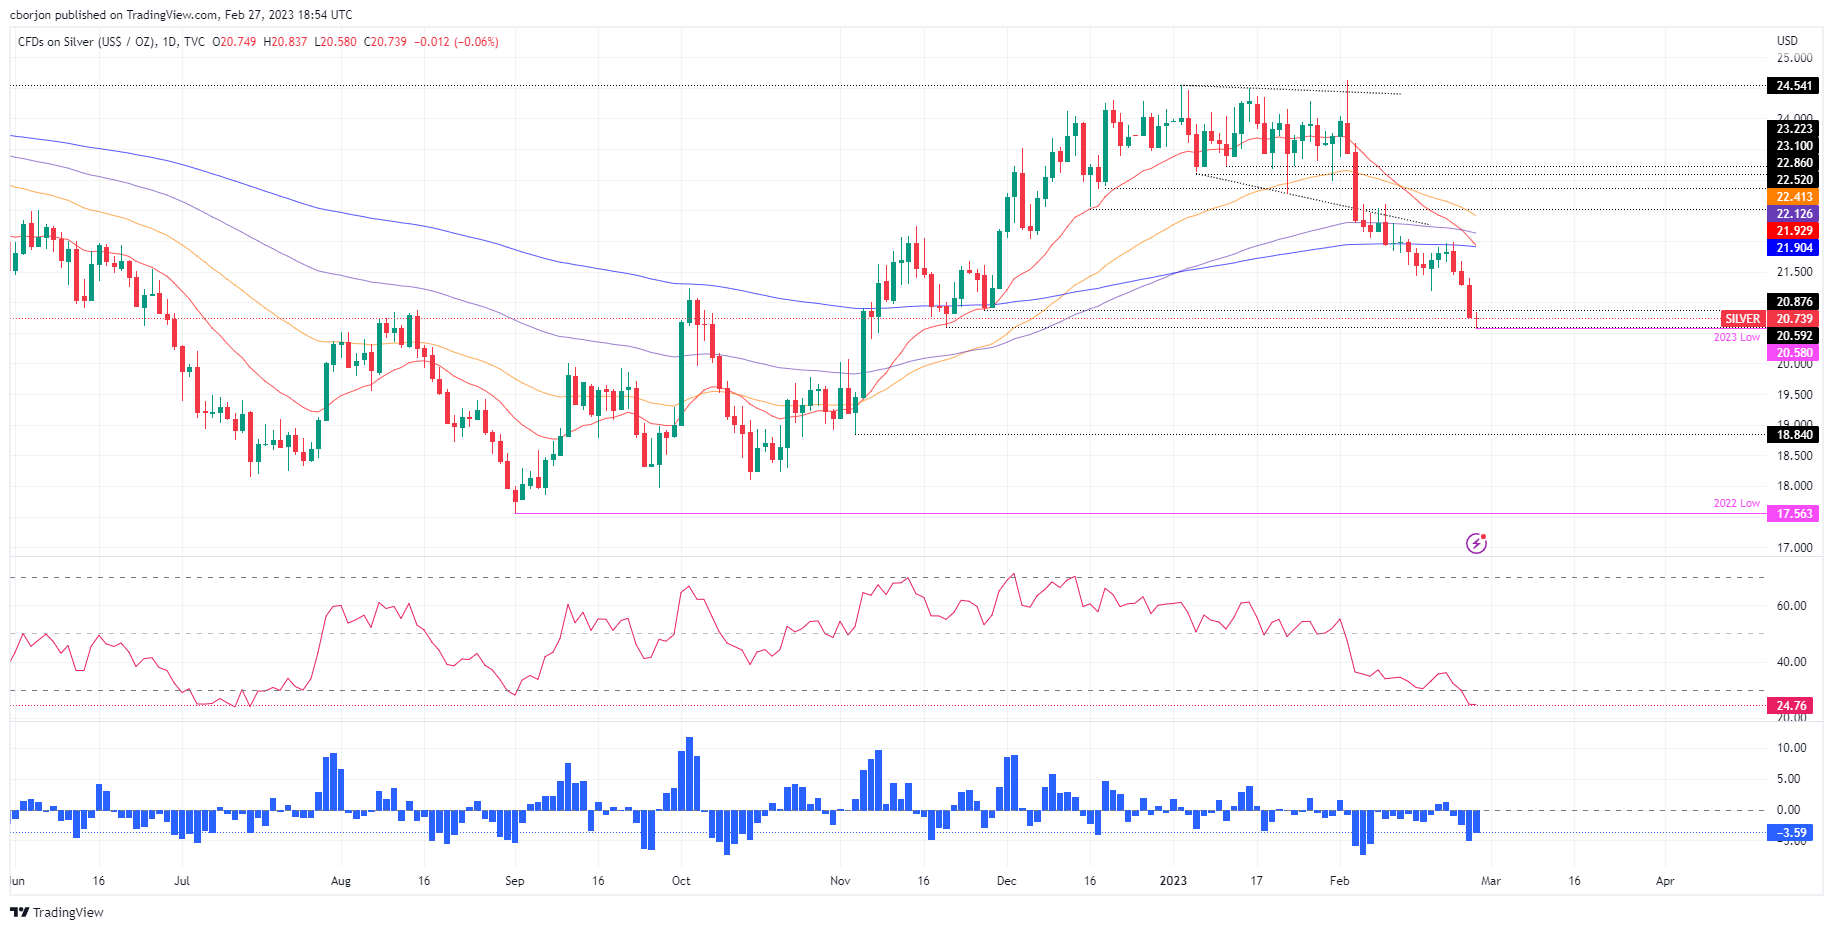
Silver Price Analysis: XAG/USD refreshes YTD lows below $20.60
- Silver price prolongs its losses to four consecutive days after slumping below the 200-DMA.
- Silver Price Analysis: A bearish continuation is likely, even though RSI is oversold; caution is warranted.

Silver price dropped to a fresh YTD low of $20.58 a troy ounce but has trimmed some of its losses. Even though the US Dollar (USD) remains soft and the US bond yields are down, the white metal is losing 0.14%. At the time of writing, the XAG/USD exchanges hands at $20.72.
From a daily chart perspective, the XAG/USD is downward biased. Furthermore, the 20-day Exponential Moving Average (EMA) is about to cross below the 200-day EMA, triggering a death cross and exacerbating a fall toward the next demand area, the November 3 daily low of $18.84. A breach of the latter would open the door for further downside, exposing crucial support zones. The critical support areas exposed would be October’s 14 low of $18.09, followed by September’s 28 at 17.97, ahead of last year’s low at $17.56.
Even though the path of least resistance is downwards, the Relative Strength Index (RSI) at oversold conditions could trigger consolidation before the bearish continuation.
As an alternate scenario, the XAG/USD first resistance would be the psychological $21.00 figure. Once reclaimed, bulls could drive prices towards the February 24 high at $21.39, followed by February 23 daily high at 21.67. Next, the 20/200-day EMAs intersection would be tested, around $21.90s.
XAG/USD Daily chart
XAG/USD Key technical levels
Author

Christian Borjon Valencia
FXStreet
Markets analyst, news editor, and trading instructor with over 14 years of experience across FX, commodities, US equity indices, and global macro markets.


