|

Silver Price Analysis: XAG/USD rebounds from over one-month lows, bearish potential intact

  • Silver recovered a major part of its early lost ground to over one-month lows.
  • The set-up favours bearish traders and supports prospects for further losses.
  • A sustained move beyond the $27.00 is needed to negate the bearish outlook.

Silver (XAG/USD) has managed to recover a major part of the intraday losses to over one-month lows and was last seen hovering near the top end of its daily trading range, around mid-$26.00s.

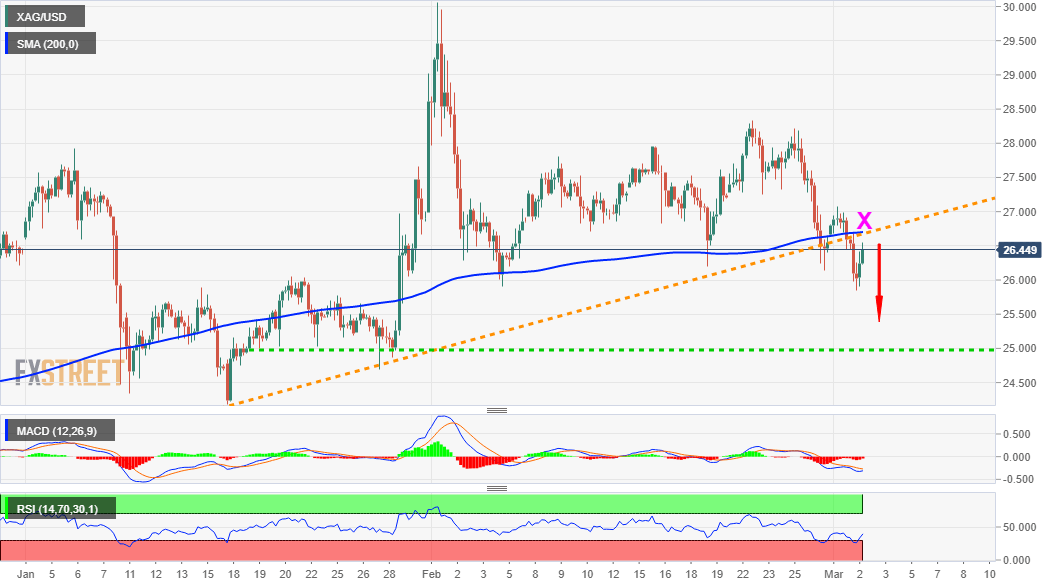
From a technical perspective, a sustained break below the $26.70 confluence support was seen as a key trigger for bearish traders. The mentioned region comprised of 200-period SMA on the 4-hourly chart and a short-term ascending trend-line extending from mid-January. This should now act as a key pivotal point for the white metal's near-term trajectory.

Meanwhile, technical indicators on the said chart maintained their bearish bias and have just started drifting into the negative territory on the daily chart. Hence, any subsequent move up might still be seen as a selling opportunity and runs the risk of fizzling out rather quickly near the $26.70 confluence support breakpoint, now turned resistance.

The XAG/USD seems vulnerable to extend its recent sharp pullback from the $30.00 psychological mark and slide further towards intermediate support near the $25.45-35 congestion zone. The downfall could further get extended towards the $25.00 key level en-route the $24.75-70 region and YTD lows, around the $24.00 mark touched on January 18.

On the flip side, momentum beyond the $26.70 support-turned-resistance might trigger a short-covering move, though is likely to remain capped near the $27.00 area. A sustained move beyond will negate the near-term bearish bias and push the commodity back towards a strong horizontal resistance near the $28.00 round-figure mark.

XAG/USD 4-hourly chart

fxsoriginal

Technical levels to watch

XAG/USD

Overview
Today last price26.5
Today Daily Change0.00
Today Daily Change %0.00
Today daily open26.5
 
Trends
Daily SMA2027.15
Daily SMA5026.47
Daily SMA10025.37
Daily SMA20023.99
 
Levels
Previous Daily High27.08
Previous Daily Low26.44
Previous Weekly High28.33
Previous Weekly Low26.14
Previous Monthly High30.07
Previous Monthly Low25.9
Daily Fibonacci 38.2%26.68
Daily Fibonacci 61.8%26.84
Daily Pivot Point S126.27
Daily Pivot Point S226.04
Daily Pivot Point S325.63
Daily Pivot Point R126.91
Daily Pivot Point R227.31
Daily Pivot Point R327.54

Author

Haresh Menghani

Haresh Menghani is a detail-oriented professional with 10+ years of extensive experience in analysing the global financial markets.

More from Haresh Menghani
Share:

Editor's Picks

EUR/USD faces some resistance near 100-SMA on H4, around 1.1830 zone

The EUR/USD pair gains some follow-through positive traction for the second consecutive day and climbs to the 1.1830 region during the Asian session on Thursday. The US Dollar remains on the back foot amid concerns about the economic fallout from US President Donald Trump's erratic trade policies and acts as a tailwind for spot prices.

GBP/USD extends recovery to near 20-day EMA as US Dollar weakens

The Pound Sterling holds onto weekly gains around 1.3565 against the US Dollar during the Asian trading session on Thursday. The GBP/USD pair trades firmly as the US Dollar remains under pressure due to uncertainty surrounding the United States trade policy outlook.

Gold struggle with $5,200 extends ahead of more US-Iran talks

Gold is replicating the recovery moves seen in Wednesday’s Asian trading early Thursday, as buyers continue to flirt with the $5,200 level. Sustained US Dollar weakness and looming US-Iran talks aid the bright metal’s rebound.  

Top Crypto Gainers: Polkadot, Near Protocol, Uniswap lead market rebound

Altcoins, such as Polkadot, Near Protocol, and Uniswap, are leading gains over the last 24 hours as Bitcoin jumped 6% on Wednesday. The altcoins are holding steady at press time on Thursday following a rebound the previous day, testing the waters around their 50-day Exponential Moving Average. 

Nvidia delivers another monster earnings report, and forecasts big things to come

It was another monster earnings report from Nvidia for fiscal Q4. Revenues were $68.1bn, smashing estimates of $65bn. Gross profit margin was a healthy 75%, up from 73.5% in the prior quarter, and the outlook for this quarter was monstrous.

Cosmos Hub Price Forecast: ATOM rebounds slightly, bearish outlook remains intact

Cosmos Hub (ATOM) price rebounds, trading above $2.05 at the time of writing on Wednesday, after undergoing a sharp correction since last week. Weakening on-chain and derivatives data support a bearish outlook, while technical analysis remains unfavorable.