- Silver retreats five-week-old horizontal resistance, pressured around intraday low of late.
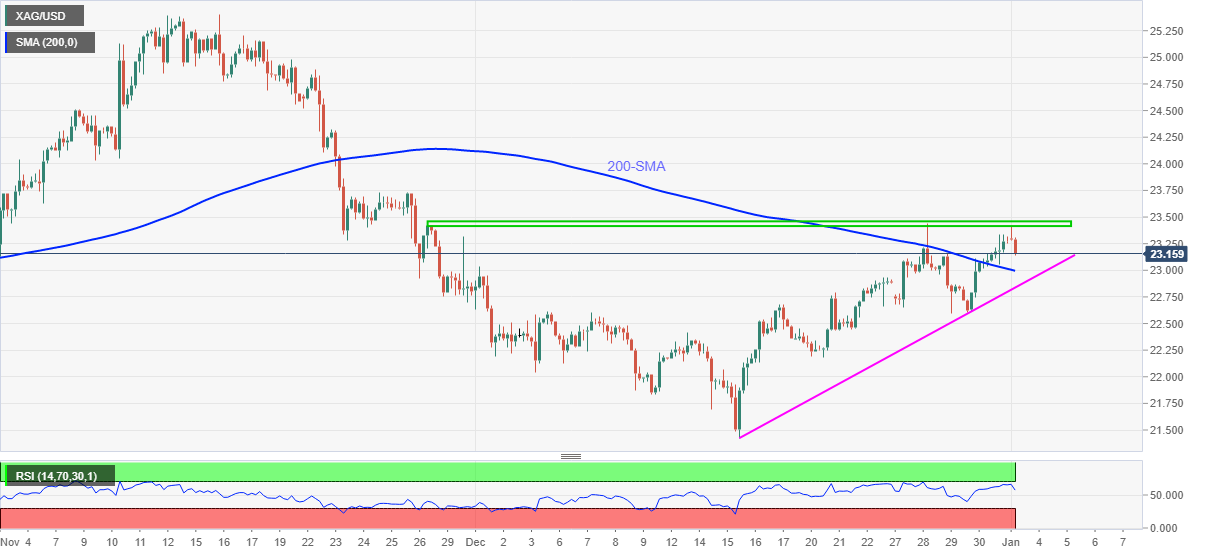
- 200-SMA, short-term support line challenges further downside even as RSI pullback favor sellers.
- Upside break of $23.50 will confirm a bullish cup-and-handle chart pattern.
Silver begins 2022 with mild losses of around 0.50% intraday while stepping back from the weekly top towards $23.00 during early Monday.
In doing so, the bright metal eases from a five-week-old horizontal resistance area, surrounding $23.40-45.
Given the RSI line’s retreat from the nearly overbought region, the latest declines in silver prices are likely determined to aim for the 200-SMA level surrounding the $23.00 threshold.
Following that, an upward sloping support line from December 15, around $22.80, will be in focus.
Meanwhile, an upside clearance of the $23.45 will need validation from multiple tops marked during late November surrounding $23.75.
Following that, a confirmation of the bullish cup-and-handle chart pattern will play its role to direct XAG/USD buyers toward the mid-$25.00 zone.
To sum up, silver prices are likely to witness further declines but the bears have miles to go.
Silver: Four-hour chart
Trend: Pullback expected
Information on these pages contains forward-looking statements that involve risks and uncertainties. Markets and instruments profiled on this page are for informational purposes only and should not in any way come across as a recommendation to buy or sell in these assets. You should do your own thorough research before making any investment decisions. FXStreet does not in any way guarantee that this information is free from mistakes, errors, or material misstatements. It also does not guarantee that this information is of a timely nature. Investing in Open Markets involves a great deal of risk, including the loss of all or a portion of your investment, as well as emotional distress. All risks, losses and costs associated with investing, including total loss of principal, are your responsibility. The views and opinions expressed in this article are those of the authors and do not necessarily reflect the official policy or position of FXStreet nor its advertisers. The author will not be held responsible for information that is found at the end of links posted on this page.
If not otherwise explicitly mentioned in the body of the article, at the time of writing, the author has no position in any stock mentioned in this article and no business relationship with any company mentioned. The author has not received compensation for writing this article, other than from FXStreet.
FXStreet and the author do not provide personalized recommendations. The author makes no representations as to the accuracy, completeness, or suitability of this information. FXStreet and the author will not be liable for any errors, omissions or any losses, injuries or damages arising from this information and its display or use. Errors and omissions excepted.
The author and FXStreet are not registered investment advisors and nothing in this article is intended to be investment advice.
Recommended content
Editors’ Picks
EUR/USD snaps its four-day losing streak, hovers around 1.0650, focus on German IFO data

The EUR/USD pair snaps its four-day losing streak during the early Asian session on Monday. Market participants will digest the outcome of the Federal Reserve (Fed) meeting last week and await the US Core Personal Consumption Expenditure (PCE) index data due on Thursday.
GBP/USD weekly forecast: Pound struggles on persisting Dollar strength

The GBP/USD pair posted its third consecutive weekly decline, continuing a bearish trend that began in mid-July. Since then, it has fallen from near 1.3100 to 1.2232, reaching the lowest level since March on Friday.
Gold recovers some ground above $1,920, investors await US GDP, PCE

Gold price recovers its recent losses near $1,924 during the early Asian trading hours on Monday. Meanwhile, the US Dollar Index (DXY), a measure of the value of USD relative to a basket of foreign currencies, recorded its tenth consecutive weekly gain and hovers around 105.55.
Worldcoin Price Prediction: Is WLD done with uptrend after 77% rally?

Worldcoin price has paused its uptrend as it currently trades at $1.57. This move comes after the altcoin rallied a whopping 77% in just three days, between September 13 and 16. As WLD hovers aimlessly, investors need to be patient to catch the next volatile move.
Week ahead – US core PCE and Eurozone flash CPIs eyed after rate pause signals [Video]
![Week ahead – US core PCE and Eurozone flash CPIs eyed after rate pause signals [Video]](https://editorial.fxstreet.com/images/Macroeconomics/EconomicIndicator/Prices/CPI/consumer-price-index-gm500080630-80587217_XtraSmall.jpg)
PCE inflation to grab attention on Friday as Fed signals higher for longer. But markets might be more worried about a government shutdown. Eurozone flash CPIs will also be the in the spotlight on Friday. Chinese PMIs to be watched for recovery signs.