Silver Price Analysis: XAG/USD oscillates in a range below 100-hour SMA, $25.00 mark


  • Silver struggles to capitalize on the overnight goodish rebound from the $24.50 support zone.
  • The technical setup seems tilted in favour of bulls and supports prospects for additional gains.
  • A convincing break below the $24.40-30 resistance-turned-support will negate the positive bias.

Silver edges higher on Friday, albeit struggles to capitalize on the move beyond 100-hour Simple Moving Average (SMA) and remains capped near the $25.00 psychological mark through the early European session.

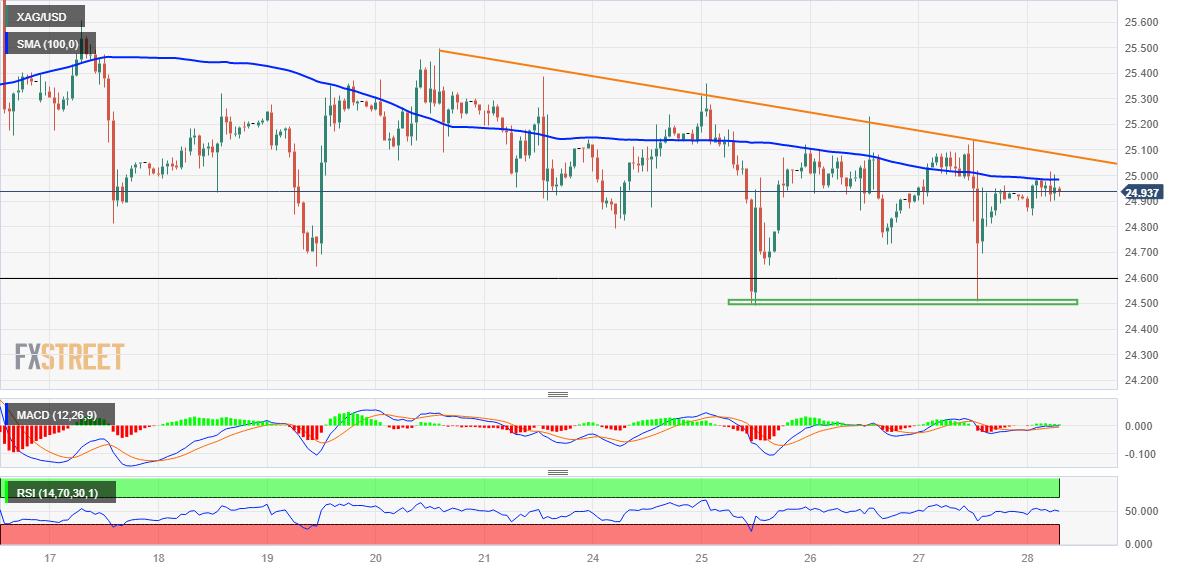
From a technical perspective, the XAG/USD has been showing some resilience below the 23.6% Fibonacci retracement level of the March-April rally and finding support ahead of the $24.40-$24.30 strong horizontal resistance breakpoint. The subsequent bounce, along with positive oscillators on the daily chart, favour bullish traders and support prospects for additional gains. That said, it will still be prudent to wait for some follow-through buying beyond the $25.00 mark before placing fresh bullish bets.

The XAG/USD might then accelerate the momentum towards the $25.50-$25.60 supply zone. A sustained strength beyond will negate any near-term negative bias and allow the white metal to make a fresh attempt to conquer the $26.00 round-figure mark and retest a one-year high touched earlier this month. Some follow-through buying should pave the way for an extension of the positive momentum towards the next relevant hurdle near the $26.25-$26.30 region en route to the $27.00 round-figure mark.

On the flip side, the $24.50-$24.40 region might continue to act as immediate strong support, which if broken decisively might prompt some technical selling. The XAG/USD might then weaken further below the $24.00 mark and test the 38.2% Fibo. level, around the $23.70 area. The corrective decline could get extended further towards the $23.35-$23.30 horizontal support before the metal eventually drops to the $23.00 round-figure mark, representing the 50% Fibo. level.

Silver 1-hour chart

fxsoriginal

Key levels to watch

XAG/USD

Overview
Today last price 24.95
Today Daily Change 0.02
Today Daily Change % 0.08
Today daily open 24.93
 
Trends
Daily SMA20 24.97
Daily SMA50 23
Daily SMA100 23.2
Daily SMA200 21.54
 
Levels
Previous Daily High 25.14
Previous Daily Low 24.51
Previous Weekly High 25.6
Previous Weekly Low 24.64
Previous Monthly High 24.16
Previous Monthly Low 19.9
Daily Fibonacci 38.2% 24.9
Daily Fibonacci 61.8% 24.75
Daily Pivot Point S1 24.58
Daily Pivot Point S2 24.23
Daily Pivot Point S3 23.95
Daily Pivot Point R1 25.21
Daily Pivot Point R2 25.49
Daily Pivot Point R3 25.84


Share: Feed news

Information on these pages contains forward-looking statements that involve risks and uncertainties. Markets and instruments profiled on this page are for informational purposes only and should not in any way come across as a recommendation to buy or sell in these assets. You should do your own thorough research before making any investment decisions. FXStreet does not in any way guarantee that this information is free from mistakes, errors, or material misstatements. It also does not guarantee that this information is of a timely nature. Investing in Open Markets involves a great deal of risk, including the loss of all or a portion of your investment, as well as emotional distress. All risks, losses and costs associated with investing, including total loss of principal, are your responsibility. The views and opinions expressed in this article are those of the authors and do not necessarily reflect the official policy or position of FXStreet nor its advertisers. The author will not be held responsible for information that is found at the end of links posted on this page.

If not otherwise explicitly mentioned in the body of the article, at the time of writing, the author has no position in any stock mentioned in this article and no business relationship with any company mentioned. The author has not received compensation for writing this article, other than from FXStreet.

FXStreet and the author do not provide personalized recommendations. The author makes no representations as to the accuracy, completeness, or suitability of this information. FXStreet and the author will not be liable for any errors, omissions or any losses, injuries or damages arising from this information and its display or use. Errors and omissions excepted.

The author and FXStreet are not registered investment advisors and nothing in this article is intended to be investment advice.

Recommended content


Recommended content

Editors’ Picks

EUR/USD regains traction, recovers above 1.0700

EUR/USD regains traction, recovers above 1.0700

EUR/USD regained its traction and turned positive on the day above 1.0700 in the American session. The US Dollar struggles to preserve its strength after the data from the US showed that the economy grew at a softer pace than expected in Q1.

EUR/USD News

GBP/USD returns to 1.2500 area in volatile session

GBP/USD returns to 1.2500 area in volatile session

GBP/USD reversed its direction and recovered to 1.2500 after falling to the 1.2450 area earlier in the day. Although markets remain risk-averse, the US Dollar struggles to find demand following the disappointing GDP data.

GBP/USD News

Gold climbs above $2,340 following earlier drop

Gold climbs above $2,340 following earlier drop

Gold fell below $2,320 in the early American session as US yields shot higher after the data showed a significant increase in the US GDP price deflator in Q1. With safe-haven flows dominating the markets, however, XAU/USD reversed its direction and rose above $2,340.

Gold News

XRP extends its decline, crypto experts comment on Ripple stablecoin and benefits for XRP Ledger

XRP extends its decline, crypto experts comment on Ripple stablecoin and benefits for XRP Ledger

Ripple extends decline to $0.52 on Thursday, wipes out weekly gains. Crypto expert asks Ripple CTO how the stablecoin will benefit the XRP Ledger and native token XRP. 

Read more

After the US close, it’s the Tokyo CPI

After the US close, it’s the Tokyo CPI

After the US close, it’s the Tokyo CPI, a reliable indicator of the national number and then the BoJ policy announcement. Tokyo CPI ex food and energy in Japan was a rise to 2.90% in March from 2.50%.

Read more

Forex MAJORS

Cryptocurrencies

Signatures