|

Silver Price Analysis: XAG/USD keeps the red below $24.00, downside seems cushioned

  • Silver comes under heavy selling pressure on Monday, though lacks follow-through.
  • The technical setup still supports prospects for the emergence of some dip-buying.
  • A convincing break below the $23.00 mark is needed to negate the positive outlook.

Silver kicks off the new week on a downbeat note and snaps a four-day winning streak to a nearly two-month high, around the $24.15 region touched on Friday. The white metal maintains its offered tone through the early part of the European session and trades around the $23.75 zone, down over 1.30% for the day.

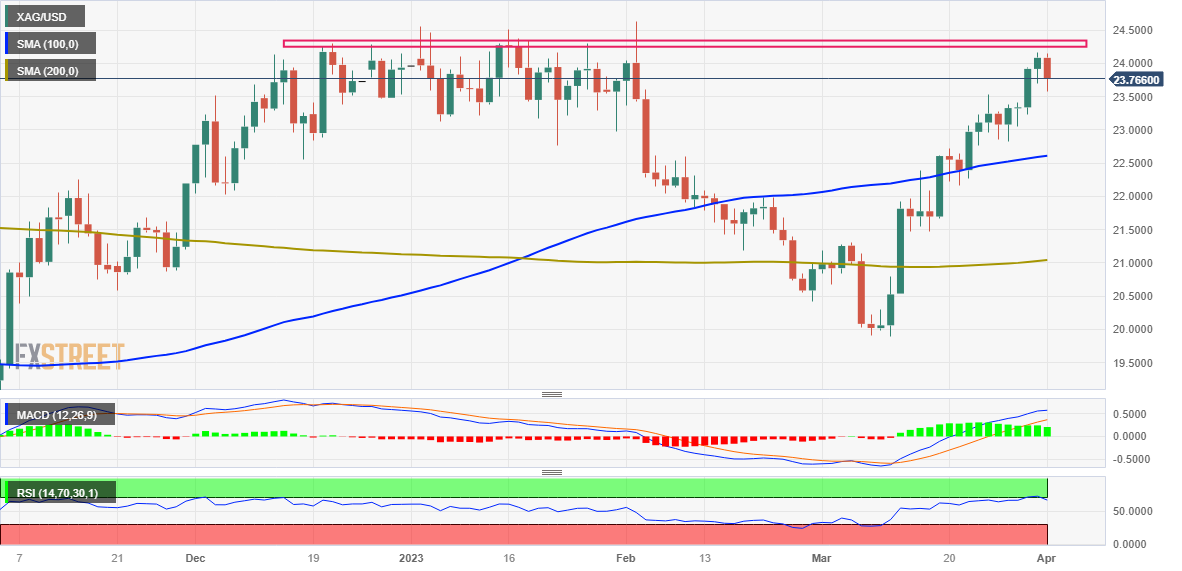
From a technical perspective, the recent strong move up from the YTD low - levels just below the $20.00 psychological mark, stalls ahead of the $24.20-$24.25 static resistance, which should now act as a pivotal point. Some follow-through buying, leading to a subsequent strength beyond the multi-month peak, around the $24.60-$24.65 area touched in February, will b seen as a fresh trigger for bullish traders.

Given that oscillators on the daily chart have pulled back from overbought territory, the XAG/USD might then aim to reclaim the $25.00 psychological mark for the first time since April 2022. The upward trajectory could get extended further towards the next relevant hurdle near the $25.75-$25.80 region en route to the $26.00 round-figure mark and the April 2022 swing high, around the $26.20-$26.25 area.

On the flip side, the daily low, just ahead of the mid-$23.00s, now seems to protect the immediate downside. Any subsequent slide is more likely to attract fresh buyers near the $23.00 mark and remain limited near the $22.80-$22.75 region. That said, a convincing break below might prompt some technical selling and drag the XAG/USD towards the $22.25 intermediate support en route to the $22.00 round-figure mark.

Silver daily chart

fxsoriginal

Key levels to watch

XAG/USD

Overview
Today last price23.76
Today Daily Change-0.32
Today Daily Change %-1.33
Today daily open24.08
 
Trends
Daily SMA2022.17
Daily SMA5022.21
Daily SMA10022.59
Daily SMA20021.03
 
Levels
Previous Daily High24.16
Previous Daily Low23.7
Previous Weekly High24.16
Previous Weekly Low22.83
Previous Monthly High24.16
Previous Monthly Low19.9
Daily Fibonacci 38.2%23.98
Daily Fibonacci 61.8%23.87
Daily Pivot Point S123.8
Daily Pivot Point S223.51
Daily Pivot Point S323.33
Daily Pivot Point R124.27
Daily Pivot Point R224.45
Daily Pivot Point R324.73

Author

Haresh Menghani

Haresh Menghani is a detail-oriented professional with 10+ years of extensive experience in analysing the global financial markets.

More from Haresh Menghani
Share:

Editor's Picks

AUD/USD eyes 0.7150 barrier nine-day EMA

AUD/USD inches higher after registering modest losses in the previous day, trading around 0.7130 during the Asian hours. The technical analysis of the daily chart indicates that the pair is moving sideways within the rectangle pattern, suggesting a consolidation as neither the bulls nor the bears have enough momentum to take control of the market.

USD/JPY trades below 160.00 intervention threshold; bullish bias intact

The USD/JPY pair attracts some sellers during the Asian session amid fears that authorities will step in again to prop up the Japanese Yen. Furthermore, the Israel-Lebanon truce prompts some profit-taking around the US Dollar and exerts downward pressure on the currency pair.

Gold defends 200-day SMA at $4,425, but for how long?

Gold is attempting a tepid recovery toward $4,500 early Thursday, as renewed optimism in the Mideast geopolitical front calms market nerves. This cautious optimism across Asian markets weighs on Oil prices, and diminishes the US Dollar’s safe-haven appeal, helping Gold stage a decent comeback from the weekly low of $4,424.


Hyperliquid: ETF demand, capital rotation fuel HYPE rally as Bitcoin melts

Hyperliquid price sustains an upward trend near its all-time high of $75.76 on Thursday after posting 80% gains in May, while Bitcoin (BTC) retraces below $65,000, triggering a market-wide panic.

Kevin Warsh takes the Fed helm: What it means for the US Dollar
The Federal Reserve moves away from the highly predictable "forward guidance" model of the Jerome Powell era to a new “Kevin Warsh environment”, characterized by less communication, more policy surprises, and an increased focus on the Fed's complex balance sheet.
Recession on paper: What really moves the Canadian Loonie now?

Statistics Canada handed the headline writers a gift and the analysts a headache. Real GDP shrank 0.1% on an annualized basis in the first quarter, and with the fourth quarter of 2025 revised down to a 1.0% contraction, that is two negative quarters in a row, the textbook definition of a technical recession and Canada's first since the pandemic.