|

Silver Price Analysis: XAG/USD holds steady above $26.00 mark, 50% Fibo. continues to cap

  • Silver attracted some dip-buying on Monday, though lacked any strong follow-through.
  • The formation of a rectangle points to a brief consolidation before the next leg down.
  • Sustained weakness below the $25.70 confluence will reaffirm a bearish breakdown.

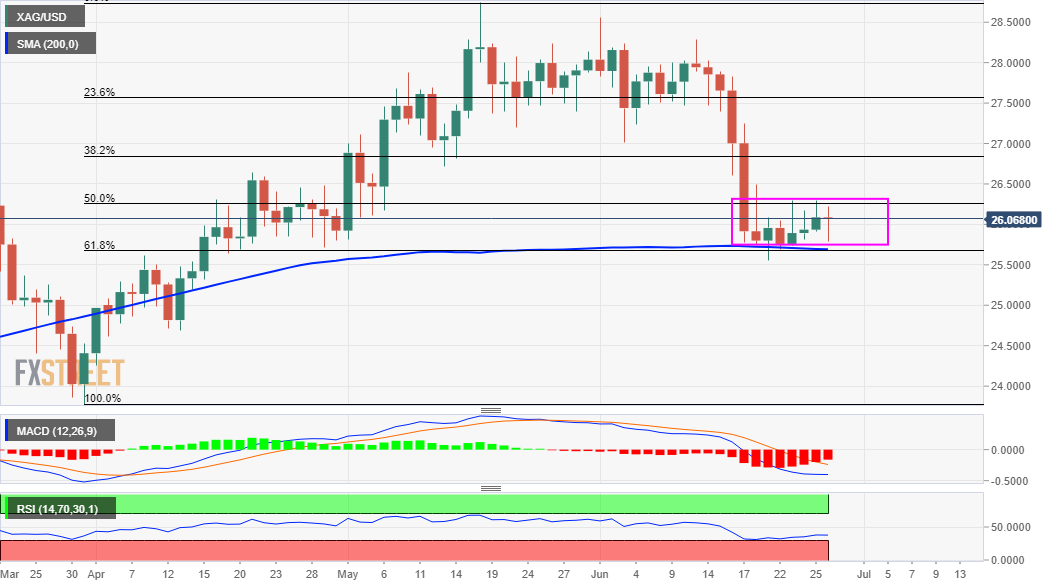
Silver reversed an intraday dip to the $25.80 region and inched back closer to daily tops during the early European session. The uptick, however, lacked any follow-through and remained capped near the $26.25-30 resistance zone. The mentioned barrier coincides with the 50% Fibonacci level of the $23.78-$28.75 move up and should now act as a key pivotal point for intraday traders.

Looking at the broader picture, the XAG/USD has been oscillating in a narrow band between the 50% Fibo. and the 61.8% Fibo. level over the past one week or so. The range-bound price action constitutes the formation of a rectangle on short-term charts. Given the recent slump, the rectangle might be categorized as a bearish consolidation phase and supports prospects for further weakness.

The negative outlook is reinforced by the fact that oscillators on the daily chart are holding deep in the bearish territory. That said, traders are likely to wait for a sustained break below the $25.70 region (61.8% Fibo.) before placing fresh bearish bets. The latter coincides with the very important 200-day SMA, which if broken decisively will set the stage for a further depreciating move.

The next relevant support is pegged near the $25.55 region before the XAG/USD eventually drops to the key $25.00 psychological mark en-route the $24.80 horizontal level. Some follow-through selling would turn the white metal vulnerable to extend the decline towards the $24.00 mark. The downward trajectory could eventually drag the commodity towards YTD lows, around the $23.80-75 zone touched in March.

Conversely, a sustained strength beyond the trading range hurdle near the $26.25-30 area will negate the bearish outlook and prompt some short-covering move. The XAG/USD might then look to build on the recent bounce and accelerate the positive move towards an intermediate resistance near the $26.55-60 supply zone. The momentum could further get extended towards the $26.85 region, or the 38.2% Fibo.

Silver daily chart

fxsoriginal

Technical levels to watch

XAG/USD

Overview
Today last price26.06
Today Daily Change-0.03
Today Daily Change %-0.11
Today daily open26.09
 
Trends
Daily SMA2027.12
Daily SMA5027.06
Daily SMA10026.57
Daily SMA20025.7
 
Levels
Previous Daily High26.3
Previous Daily Low25.92
Previous Weekly High26.3
Previous Weekly Low25.55
Previous Monthly High28.75
Previous Monthly Low25.81
Daily Fibonacci 38.2%26.15
Daily Fibonacci 61.8%26.06
Daily Pivot Point S125.9
Daily Pivot Point S225.72
Daily Pivot Point S325.52
Daily Pivot Point R126.29
Daily Pivot Point R226.48
Daily Pivot Point R326.67

Author

Haresh Menghani

Haresh Menghani is a detail-oriented professional with 10+ years of extensive experience in analysing the global financial markets.

More from Haresh Menghani
Share:

Editor's Picks

EUR/USD extends losses toward 1.1600 ahead of EU inflation data

EUR/USD extends the decline toward 1.1600 in the European session on Tuesday. The pair remains under pressure as surging energy prices amid the US-Iran war have increased the risks of higher inflation for the Old Continent. The focus is now on the Eurozone preliminary inflation reading for February. 

GBP/USD attacks 1.3300, refreshing three-month lows

GBP/USD is deep in the red near 1.3300, accelerating its downside to renew three-month lows in European trading on Tuesday. The ongoing escalation in the Iran war, combined with rising Oil prices, weighs negatively on the higher-yielding Pound Sterling as the US Dollar capitalizes on increased haven demand.

Gold falls below $5,300 as stronger USD counter Middle East woes

Gold attracts some intraday selling and falls below $5,300 on Tuesday. The US Dollar climbs to a fresh high since January 20 and turns out to be a key factor exerting downward pressure on the commodity. However, concerns about a broader regional conflict in the Middle East continue to weigh on investors' sentiment and underpin demand for the traditional safe-haven bullion.

Stellar risks deeper losses as derivatives metrics turn negative

Stellar is trading red below $0.16 at the time of writing on Tuesday, after a slight recovery the previous day. Weakening derivatives data caps the recovery, while an unfavorable technical outlook projects a deeper correction for the XLM token in the upcoming days.

The market is not panicking it is repricing the probability distribution of Oil and time

At the end of the day, markets do not trade morality or geopolitics. They trade transmission channels. And the only channel that truly matters in this maelstrom runs through the price of energy and the time value of money.

Hyperliquid Price Forecast: HYPE rises on commodities demand amid US-Iran war

Hyperliquid (HYPE) steadies above $33 at press time on Tuesday, marking its fourth consecutive day of recovery in a broadly volatile market due to the ongoing US-Israel strikes on Iran.