Silver Price Analysis: XAG/USD hangs near weekly lows, below $28.00 mark


  • Silver witnessed some fresh selling on Thursday and erased the previous day’s modest gains.
  • The range-bound price action constitutes the formation of a rectangle on short-term charts.
  • Mixed technical indicators on hourly/daily charts warrant some caution for aggressive traders.

Silver failed to capitalize on the previous day's positive move, instead came under some renewed selling pressure on Thursday. The downfall dragged the commodity to the $27.75 area, back closer to weekly lows during the first half of the European session.

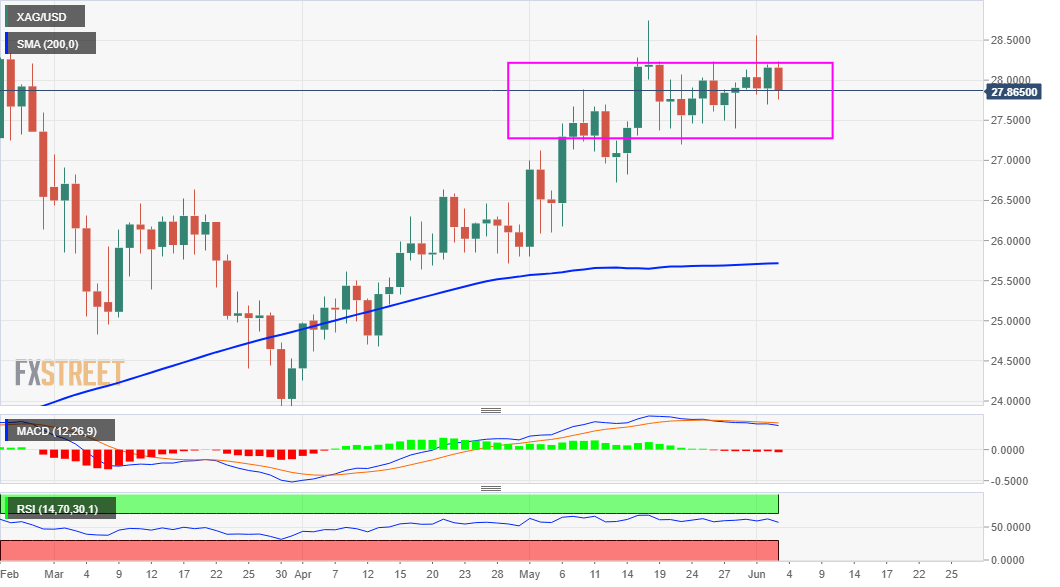
From a technical perspective, the XAG/USD – barring few knee-jerk spikes – has been oscillating in a familiar trading band over the past three weeks or so. The range-bound price action constitutes the formation of a rectangle, pointing to indecision amid traders.

Meanwhile, technical indicators on hourly charts have been gaining some negative momentum. That said, bullish oscillators on the daily chart support prospects for the emergence of some dip-buying at lower levels and warrant caution for aggressive bearish traders.

Hence, any subsequent fall might still be seen as a buying opportunity near the $27.60-55 region. This should help limit the downside near the trading range support, around the $27.35-30 region, which if broken decisively might turn the XAG/USD vulnerable to slide further.

The next relevant support is pegged near the $27.00 mark, below which the XAG/USD might accelerate the fall to the $26.45 horizontal level. The downward trajectory could get extended towards the $26.00 mark en-route the very important 200-day SMA, around the $25.70 zone.

On the flip side, the $28.00 round figure now seems to act as an immediate resistance ahead of the $28.25-30 strong barrier. This is followed by resistance near the $28.55 region, or weekly swing highs and May monthly tops, around the $28.75 region.

Bulls might wait for a sustained move beyond the mentioned hurdles before positioning for any further appreciating move. The XAG/USD might then surpass the $29.00 mark, and the $29.40-50 intermediate resistance and aim to reclaim the key $30.00 psychological mark.

XAG/USD daily chart

fxsoriginal

Technical levels to watch

XAG/USD

Overview
Today last price 27.84
Today Daily Change -0.32
Today Daily Change % -1.14
Today daily open 28.16
 
Trends
Daily SMA20 27.7
Daily SMA50 26.43
Daily SMA100 26.4
Daily SMA200 25.71
 
Levels
Previous Daily High 28.19
Previous Daily Low 27.69
Previous Weekly High 28.23
Previous Weekly Low 27.4
Previous Monthly High 28.75
Previous Monthly Low 25.81
Daily Fibonacci 38.2% 28
Daily Fibonacci 61.8% 27.88
Daily Pivot Point S1 27.84
Daily Pivot Point S2 27.52
Daily Pivot Point S3 27.34
Daily Pivot Point R1 28.33
Daily Pivot Point R2 28.51
Daily Pivot Point R3 28.83


Share: Feed news

Information on these pages contains forward-looking statements that involve risks and uncertainties. Markets and instruments profiled on this page are for informational purposes only and should not in any way come across as a recommendation to buy or sell in these assets. You should do your own thorough research before making any investment decisions. FXStreet does not in any way guarantee that this information is free from mistakes, errors, or material misstatements. It also does not guarantee that this information is of a timely nature. Investing in Open Markets involves a great deal of risk, including the loss of all or a portion of your investment, as well as emotional distress. All risks, losses and costs associated with investing, including total loss of principal, are your responsibility. The views and opinions expressed in this article are those of the authors and do not necessarily reflect the official policy or position of FXStreet nor its advertisers. The author will not be held responsible for information that is found at the end of links posted on this page.

If not otherwise explicitly mentioned in the body of the article, at the time of writing, the author has no position in any stock mentioned in this article and no business relationship with any company mentioned. The author has not received compensation for writing this article, other than from FXStreet.

FXStreet and the author do not provide personalized recommendations. The author makes no representations as to the accuracy, completeness, or suitability of this information. FXStreet and the author will not be liable for any errors, omissions or any losses, injuries or damages arising from this information and its display or use. Errors and omissions excepted.

The author and FXStreet are not registered investment advisors and nothing in this article is intended to be investment advice.

Recommended content


Recommended content

Editors’ Picks

EUR/USD stays below 1.0700 ahead of US data

EUR/USD stays below 1.0700 ahead of US data

EUR/USD stays in a consolidation phase slightly below 1.0700 in the European session on Wednesday. Upbeat IFO sentiment data from Germany helps the Euro hold its ground as market focus shifts to US Durable Goods Orders data.

EUR/USD News

USD/JPY refreshes 34-year high, attacks 155.00 as intervention risks loom

USD/JPY refreshes 34-year high, attacks 155.00 as intervention risks loom

USD/JPY is renewing a multi-decade high, closing in on 155.00. Traders turn cautious on heightened risks of Japan's FX intervention. Broad US Dollar rebound aids the upside in the major. US Durable Goods data are next on tap. 

USD/JPY News

Gold manages to hold above $2,300

Gold manages to hold above $2,300

Gold struggles to stage a rebound following Monday's sharp decline but manages to hold above $2,300. The benchmark 10-year US Treasury bond yield stays in the green above 4.6% ahead of US data, not allowing XAU/USD to gain traction.

Gold News

Worldcoin looks set for comeback despite Nvidia’s 22% crash Premium

Worldcoin looks set for comeback despite Nvidia’s 22% crash

Worldcoin price is in a better position than last week's and shows signs of a potential comeback. This development occurs amid the sharp decline in the valuation of the popular GPU manufacturer Nvidia.

Read more

Three fundamentals for the week: US GDP, BoJ and the Fed's favorite inflation gauge stand out Premium

Three fundamentals for the week: US GDP, BoJ and the Fed's favorite inflation gauge stand out

While it is hard to predict when geopolitical news erupts, the level of tension is lower – allowing for key data to have its say. This week's US figures are set to shape the Federal Reserve's decision next week – and the Bank of Japan may struggle to halt the Yen's deterioration. 

Read more

Forex MAJORS

Cryptocurrencies

Signatures