Silver Price Analysis: XAG/USD forms a bearish tweezers top, seller's eye $22.00
- Silver prices (XAG/USD) are struggling to maintain the upward momentum that started last Monday, currently facing consecutive days of losses.
- The formation of a ‘tweezers-top’ chart pattern in XAG/USD suggests a potential for further decline, with the current price at $23.48, down by 0.92%.
- If sellers maintain control and keep the price below $24.00, a pullback towards the 200-DMA is likely, with further potential decline towards the $23.00 mark.

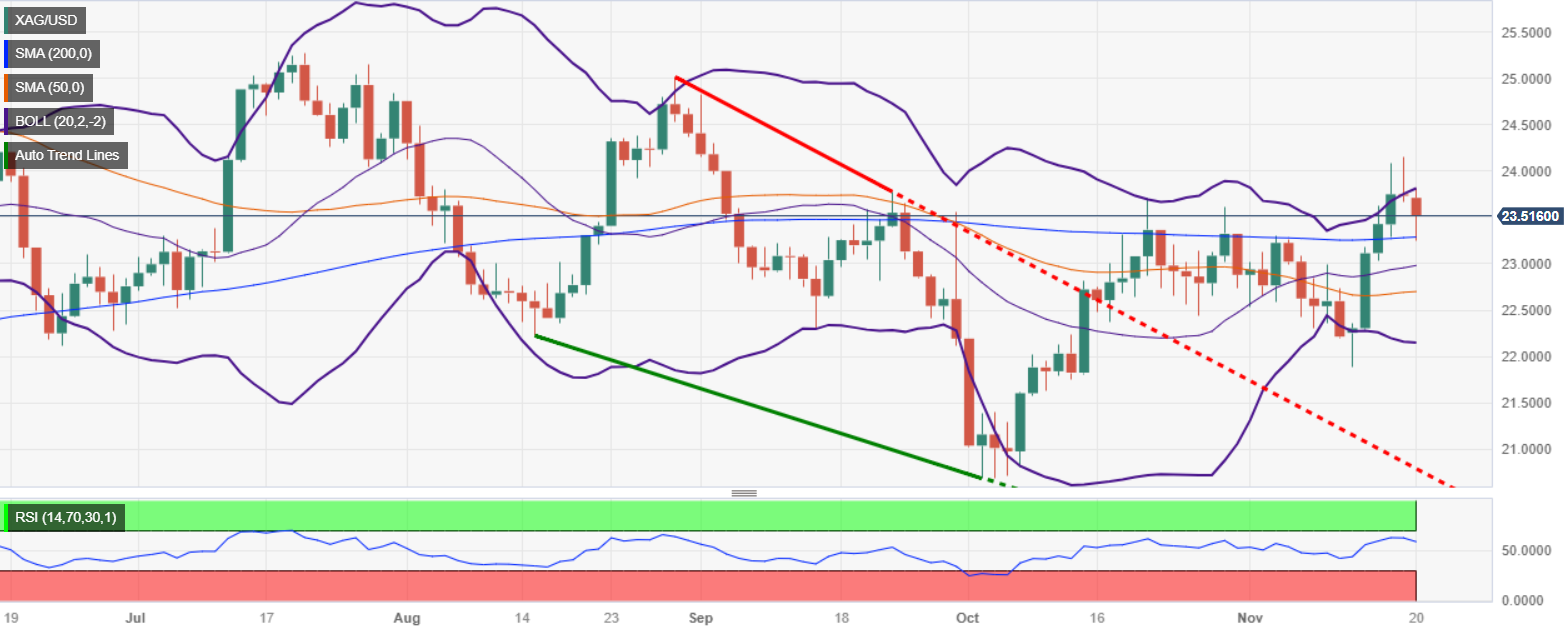
Silver price struggles to extend its rally that began last Monday, posting back-to-back days of losses, due to a risk-on impulse, despite overall US Dollar (USD) weakness across the board. From a price action standpoint, the XAG/USD formed a ‘tweezers-top’ chart pattern, which warrants further downward action is expected; hence, XAG/USD is trading at $23.48, down 0.92%.
After forming the ‘tweezers top’, the XAG/USD resumed its downtrend but it was capped by the 200-day moving average (DMA) at $23.28 before resuming above the November 16 daily low of $23.28. A daily close above the latter could open the door to re-test the $24.00 figure.
On the other hand, if sellers stepped in, and kept prices below the $24.00 mark, the chances for a pullback to the 200-DMA increase, followed by the $23.00 mark. Further downside is expected beneath that level, exposing the latest cycle low seen at $21.88, the November 13 low.
Silver Price Analysis – Daily Chart
Silver Technical Levels
Author

Christian Borjon Valencia
FXStreet
Markets analyst, news editor, and trading instructor with over 14 years of experience across FX, commodities, US equity indices, and global macro markets.


