|

Silver Price Analysis: XAG/USD flirts with $26.00 as 50-DMA prods metal bears

  • Silver price licks its wounds at the lowest levels in six weeks.
  • Downbeat RSI (14) allows 50-DMA to challenge XAG/USD bears.
  • Horizontal hurdle from early 2023, 21-DMA guard recovery moves.

Silver price (XAG/USD) struggles to defend the latest corrective from a 1.5-month low near $26.00 amid early Monday morning in Europe.

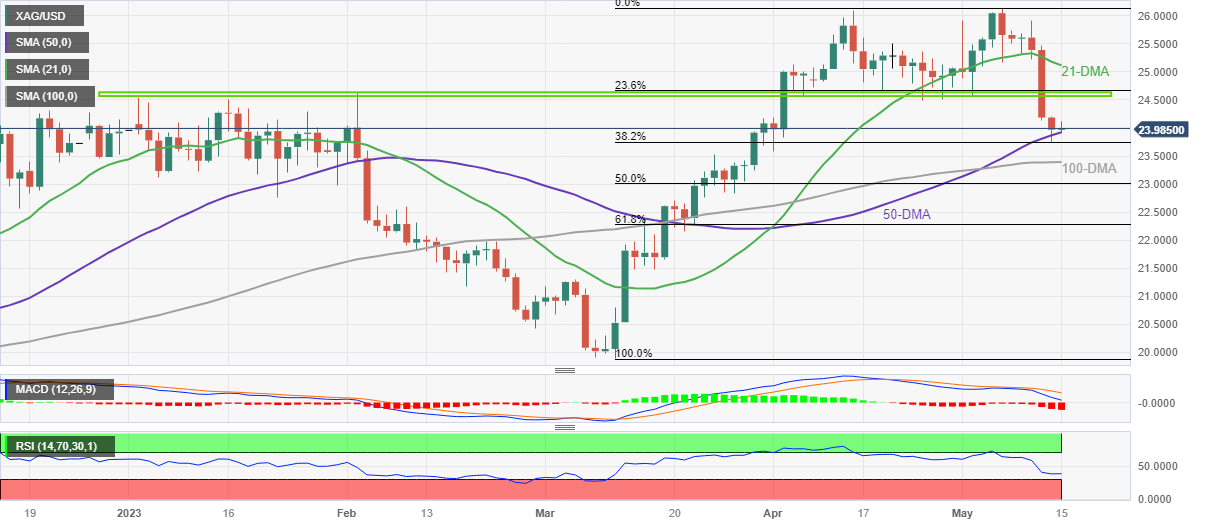
That said, the bright metal dropped to the lowest levels since early April the previous day but failed to offer a daily close beneath the 50-DMA, around $23.90 by the press time.

In addition to the failure to provide a daily close below the short-term key DMA, the downbeat conditions of the RSI (14) line also favored the Silver price’s corrective bounce on early Monday.

However, the bearish MACD signals and sustained trading below the previous key supports keep the XAG/USD bears hopeful.

That said, the corrective bounce remains elusive unless the quote stays below a horizontal area comprising multiple levels marked since early January 2023, close to $24.60.

Even if the XAG/USD rises past $24.60, the 21-DMA hurdle of around $25.10 can prod the bulls before giving them control.

On the contrary, a daily close below the 50-DMA level of near $23.90 can quickly direct the Silver price toward the 100-DMA support surrounding $23.40.

Following that, the 61.8% Fibonacci retracement level of the precious metal’s March-May upside, near $22.30, can act as the last defense of the Silver buyers.

Silver price: Daily chart

Trend: Further downside expected

Additional important levels

Overview
Today last price23.97
Today Daily Change0.00
Today Daily Change %0.00%
Today daily open23.97
 
Trends
Daily SMA2025.17
Daily SMA5023.87
Daily SMA10023.39
Daily SMA20021.85
 
Levels
Previous Daily High24.21
Previous Daily Low23.74
Previous Weekly High25.92
Previous Weekly Low23.74
Previous Monthly High26.09
Previous Monthly Low23.57
Daily Fibonacci 38.2%23.92
Daily Fibonacci 61.8%24.03
Daily Pivot Point S123.74
Daily Pivot Point S223.51
Daily Pivot Point S323.27
Daily Pivot Point R124.2
Daily Pivot Point R224.44
Daily Pivot Point R324.67

Author

Anil Panchal

Anil Panchal

FXStreet

Anil Panchal has nearly 15 years of experience in tracking financial markets. With a keen interest in macroeconomics, Anil aptly tracks global news/updates and stays well-informed about the global financial moves and their implications.

More from Anil Panchal
Share:

Editor's Picks

AUD/USD eyes 0.7150 barrier nine-day EMA

AUD/USD inches higher after registering modest losses in the previous day, trading around 0.7130 during the Asian hours. The technical analysis of the daily chart indicates that the pair is moving sideways within the rectangle pattern, suggesting a consolidation as neither the bulls nor the bears have enough momentum to take control of the market.

USD/JPY trades below 160.00 intervention threshold; bullish bias intact

The USD/JPY pair attracts some sellers during the Asian session amid fears that authorities will step in again to prop up the Japanese Yen. Furthermore, the Israel-Lebanon truce prompts some profit-taking around the US Dollar and exerts downward pressure on the currency pair.

Gold extends rebound to $4,500 as US yields edge lower

Gold (XAU/USD) preserves its recovery momentum following Wednesday's slide and tests the $4,500 mark in the second half of the day on Thursday. While US-Iran uncertainty remains, easing tensions between Lebanon on Israel seems to be helping the market mood improve, causing the USD to lose strength alongside falling US T-bond yields and opening the door for a decisive rebound in XAU/USD.

Hyperliquid: ETF demand, capital rotation fuel HYPE rally as Bitcoin melts

Hyperliquid price sustains an upward trend near its all-time high of $75.76 on Thursday after posting 80% gains in May, while Bitcoin (BTC) retraces below $65,000, triggering a market-wide panic.

Nonfarm payrolls: Testing the limits of Fed policy patience

The upcoming nonfarm payrolls report for May will provide the final update on the US labor market before Kevin Warsh attends his first policy meeting as the new Fed Chair later this month.

Recession on paper: What really moves the Canadian Loonie now?

Statistics Canada handed the headline writers a gift and the analysts a headache. Real GDP shrank 0.1% on an annualized basis in the first quarter, and with the fourth quarter of 2025 revised down to a 1.0% contraction, that is two negative quarters in a row, the textbook definition of a technical recession and Canada's first since the pandemic.