Silver Price Analysis: XAG/USD eyes sub-$19.00 zone on Bear Flag confirmation


Share:
  • Silver price fades bounce off four-month low after confirming bearish chart pattern earlier in Asia.
  • Bearish MACD signals, sustained trading below the key EMAs keep XAG/USD sellers directed toward $18.80 theoretical target.
  • Convergence of flag’s top line, 100-EMA appears short-term key upside hurdle to watch during corrective bounce.

Silver (XAG/USD) remains on the back foot around the $20.00 round figure amid early Friday in Europe, fading the bounce off the intraday low.

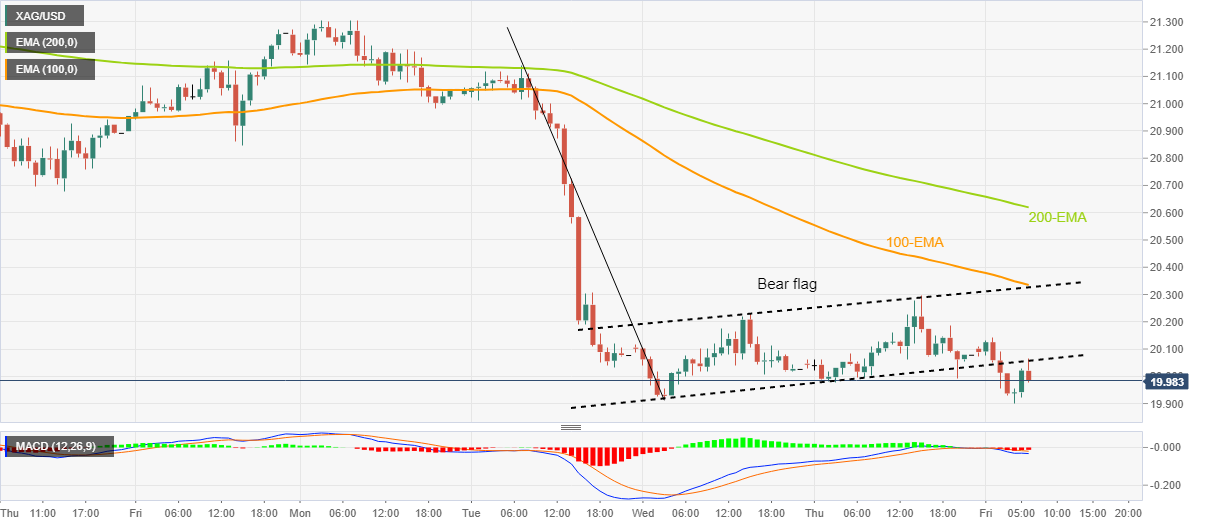
In doing so, the bright metal retreats from the lower line of a three-day-old bear flag, after confirming the downside suggesting chart formation earlier in the day.

Adding strength to the bearish bias are the downbeat MACD signals and the XAG/USD’s sustained trading below the 100 and 200 Exponential Moving Averages (EMAs).

That said, the recent lows marked around $19.90 and the latest October 2022 peak surrounding $19.75 may entertain the intraday sellers of the Silver during the theoretical target surrounding $18.80.

Meanwhile, recovery moves could aim for the convergence of the 100-EMA and the stated flag’s upper line, close to $20.35. Also acting as an upside filter is the 200-EMA level surrounding $20.65.

It should be noted that the monthly high near $21.30 holds the key to the Silver buyer’s conviction.

To sum up, the Silver price remains bearish and can refresh the four-month low marked earlier in the day.

Silver price: Hourly chart

Trend: Further downside expected

Additional important levels

Overview
Today last price 19.98
Today Daily Change -0.08
Today Daily Change % -0.40%
Today daily open 20.06
 
Trends
Daily SMA20 21.2
Daily SMA50 22.58
Daily SMA100 22.18
Daily SMA200 20.95
 
Levels
Previous Daily High 20.3
Previous Daily Low 19.98
Previous Weekly High 21.27
Previous Weekly Low 20.42
Previous Monthly High 24.64
Previous Monthly Low 20.42
Daily Fibonacci 38.2% 20.17
Daily Fibonacci 61.8% 20.1
Daily Pivot Point S1 19.93
Daily Pivot Point S2 19.8
Daily Pivot Point S3 19.61
Daily Pivot Point R1 20.24
Daily Pivot Point R2 20.43
Daily Pivot Point R3 20.56


Share: Feed news

Information on these pages contains forward-looking statements that involve risks and uncertainties. Markets and instruments profiled on this page are for informational purposes only and should not in any way come across as a recommendation to buy or sell in these assets. You should do your own thorough research before making any investment decisions. FXStreet does not in any way guarantee that this information is free from mistakes, errors, or material misstatements. It also does not guarantee that this information is of a timely nature. Investing in Open Markets involves a great deal of risk, including the loss of all or a portion of your investment, as well as emotional distress. All risks, losses and costs associated with investing, including total loss of principal, are your responsibility. The views and opinions expressed in this article are those of the authors and do not necessarily reflect the official policy or position of FXStreet nor its advertisers. The author will not be held responsible for information that is found at the end of links posted on this page.

If not otherwise explicitly mentioned in the body of the article, at the time of writing, the author has no position in any stock mentioned in this article and no business relationship with any company mentioned. The author has not received compensation for writing this article, other than from FXStreet.

FXStreet and the author do not provide personalized recommendations. The author makes no representations as to the accuracy, completeness, or suitability of this information. FXStreet and the author will not be liable for any errors, omissions or any losses, injuries or damages arising from this information and its display or use. Errors and omissions excepted.

The author and FXStreet are not registered investment advisors and nothing in this article is intended to be investment advice.

Follow us on Telegram

Stay updated of all the news

Join Telegram

Recommended content


Follow us on Telegram

Stay updated of all the news

Join Telegram

Recommended content

Editors’ Picks

EUR/USD posts highest daily close since early February Premium

EUR/USD posts highest daily close since early February

EUR/USD looks on its way to test March highs after posting the highest daily close in almost two months. The pair peaked at 1.0925 on Thursday and then settled around 1.0900. The DXY is under pressure on risk appetite. Key inflation data from the US and the Eurozone will be released on Friday.

EUR/USD News

GBP/USD eyes 1.2400 as Pound outperforms

GBP/USD eyes 1.2400 as Pound outperforms

The Pound is among the top performers of the American session. GBP/USD is trading at the highest level in almost two months, near 1.2400. Risk flows are helping the pair while at the same time making it difficult for the US Dollar to find demand.

GBP/USD News

Gold: Bulls aiming to challenge the $2,000 threshold Premium

Gold: Bulls aiming to challenge the $2,000 threshold

Spot Gold found demand during American trading hours and currently trades around the $1,980 level. Following a consolidative stage, the bright metal gained upward traction on the back of continued US Dollar weakness.

Gold News

Cardano might have a bumpy road following a 25% recovery

Cardano might have a bumpy road following a 25% recovery

Cardano price has had a disappointing run these last two weeks when compared to other major altcoins. 

Read more

FTSE100 up for 4th day in a row, hits 2-week high

FTSE100 up for 4th day in a row, hits 2-week high

We’ve seen another positive day for European markets with the FTSE100 pushing up to its highest levels in 2 weeks, although it remains well short of reversing its March losses, unlike the DAX which has reversed nearly all its post 9th March decline.  

Read more

Forex MAJORS

Cryptocurrencies

Signatures