Silver Price Analysis: XAG/USD eyes $27.80 whilst above key $27 support – Confluence Detector

Silver (XAG/USD) is off the three-month highs of $27.55, consolidating Thursday’s rally above the $27 mark. Persistent weakness in the US dollar and Treasury yields lifted silver prices while a bullish technical picture also added to the renewed optimism.
Silver tracked the rally on gold after the latter finally broke above key $1800 technical resistance and triggered stop orders. Further, news that the CME lowered its lowered initial and maintenance margins for gold, silver and platinum also offered support to the white metal.
How is Silver positioned on the technical graphs?
Silver Price Chart: Key resistance and support levels
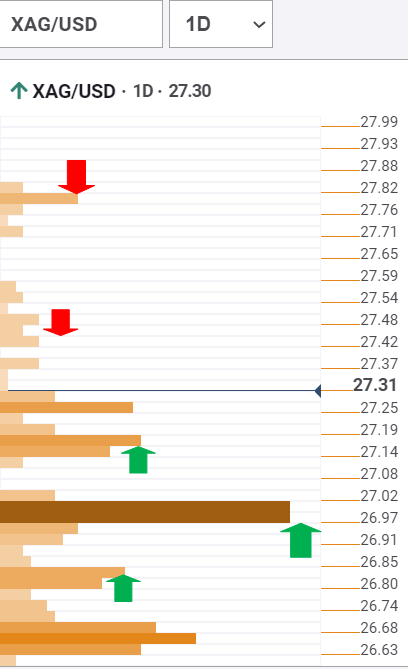
The Technical Confluences Detector shows that Silver’s path of least resistance appears to the upside amid a lack of healthy resistance level.
Therefore, the doors remain open for XAG bulls to test the $27.80 upside target, which is the pivot point one-day R1.
Ahead of that, the buyers may face some resistance around $27.50, where the previous high coincides with Bollinger Band four-hour higher.
Alternatively, immediate support is seen at $27.15, the confluence of the Fibonacci 23.6% one-day and pivot point one-week R3.
A breach of the latter could expose powerful support at $27, which is the intersection of the Fibonacci 38.2% one-day, Fibonacci 161.8% one-week and pivot point one-month R1.
The next best safety net for XAG bears awaits at $26.80, where the pivot point one-week R2 converges with SMA50 one-hour.
Here is how it looks on the tool
About Technical Confluences Detector
The TCD (Technical Confluences Detector) is a tool to locate and point out those price levels where there is a congestion of indicators, moving averages, Fibonacci levels, Pivot Points, etc. Knowing where these congestion points are located is very useful for the trader, and can be used as a basis for different strategies.
Author

Dhwani Mehta
FXStreet
Residing in Mumbai (India), Dhwani is a Senior Analyst and Manager of the Asian session at FXStreet. She has over 10 years of experience in analyzing and covering the global financial markets, with specialization in Forex and commodities markets.


