|

Silver Price Analysis: XAG/USD drops towards $23.00 on breaking key supports

  • Silver Price remains pressured after falling the most in six weeks.
  • Downside break of three-month-old support line, 100-DMA favor XAG/USD sellers.
  • Bear cross on MACD signals further downside of the Silver Price but the below-50.0 RSI prods sellers.
  • Previous monthly low, 200-DMA lures XAG/USD bears during further downside.

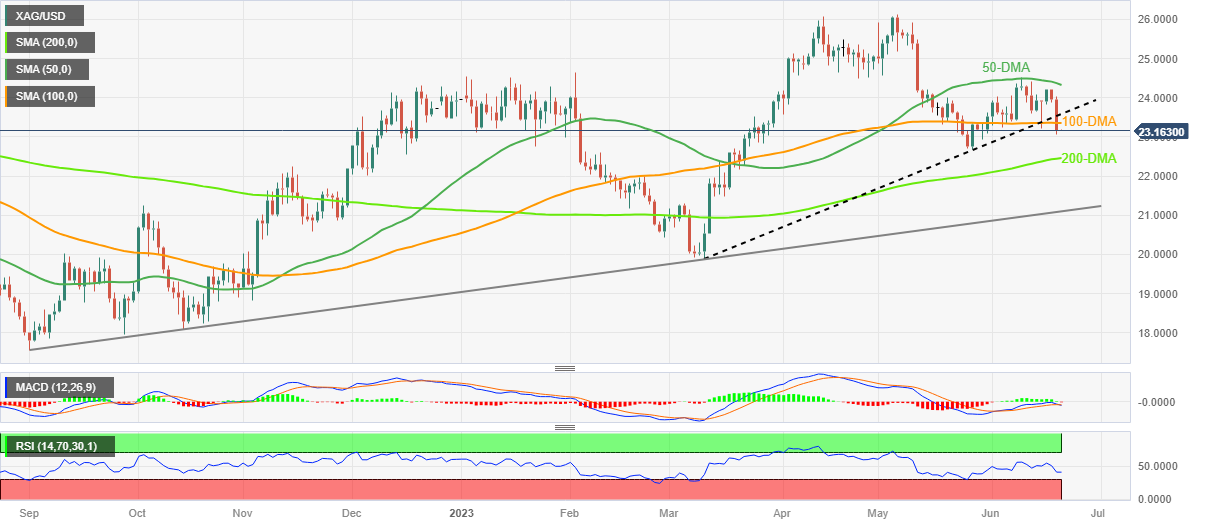
Silver Price (XAG/USD) seesaws around the monthly low marked the previous day, sidelined near $23.15 amid early Wednesday in Asia after falling the most in 1.5 months the previous day.

That said, the bright metal dropped heavily on Tuesday after breaking the key support line stretched from March, as well as the 100-DMA. The downside break of the previously important supports also took clues from the looming bear cross on the MACD, which in turn suggests further downside of the XAG/USD.

Hence, the XAG/USD’s further fall towards the $23.00 round figure appears imminent ahead of challenging the previous monthly low of around $22.70.

It’s worth noting, however, that the RSI (14) is below 50.0 and hence suggests limited downside room.

As a result, the Silver price may refrain from breaking the previous monthly low, if not then the 200-DMA level of around $22.45 can act as an extra filter towards the south.

Above all, the XAG/USD buyers remain hopeful unless witnessing a clear downside break of an ascending support line from September 2022, close to $21.10 by the press time.

On the flip side, the 100-DMA and the three-month-old previous support line, respectively around $23.35 and $23.55, guard immediate recovery of the Silver Price.

Following that, the 50-DMA hurdle of $24.35 gains the market’s attention as it holds the key to further advances of the XAG/USD.

Silver Price: Daily chart
Trend: Further downside expected

Additional important levels

Overview
Today last price23.17
Today Daily Change-0.78
Today Daily Change %-3.26%
Today daily open23.95
 
Trends
Daily SMA2023.64
Daily SMA5024.41
Daily SMA10023.36
Daily SMA20022.43
 
Levels
Previous Daily High24.2
Previous Daily Low23.89
Previous Weekly High24.4
Previous Weekly Low23.22
Previous Monthly High26.14
Previous Monthly Low22.68
Daily Fibonacci 38.2%24.01
Daily Fibonacci 61.8%24.08
Daily Pivot Point S123.82
Daily Pivot Point S223.7
Daily Pivot Point S323.51
Daily Pivot Point R124.14
Daily Pivot Point R224.33
Daily Pivot Point R324.46

Author

Anil Panchal

Anil Panchal

FXStreet

Anil Panchal has nearly 15 years of experience in tracking financial markets. With a keen interest in macroeconomics, Anil aptly tracks global news/updates and stays well-informed about the global financial moves and their implications.


More from Anil Panchal
Share:

Editor's Picks

GBP/USD retreats from multi-day highs around 1.3550

GBP/USD now gives away part of the earlier advance toward the 1.3550 region, or multi-week peaks, looking to consolidate around the 1.3530 region on Wednesday. Cable’s continuation of its march north follows the modest downside pressure on the Greenback after US CPI readings matched consensus in July.

EUR/USD eases from tops, back to 1.1550

EUR/USD now surrenders some gains and recedes toward the 1.1550 regio on Wednesday. Despite the knee-jerk, spot keeps the bid tone intact amid the offered stance in the US Dollar, all in the wake of in-line US inflation data in July. However, the fragile landscape in the Middle East is expected to put a floor to the occasional downward trend in the buck.

Gold challenges 10-week highs near $4,450

Gold now pushes harder and climbs to new two-month highs near $4,450 per troy ounce on Wednesday. The yellow metal’s solid performance comes on the back of a weaker US Dollar and declining US Treasuty yields across the curve as investors assess the latest US CPI data.

Ripple lags recovery as exchange reserves expand

Ripple is trading within a broadly constrained technical structure, with support at $1.00 and key moving averages limiting its recovery potential. In August, the remittance token declined by approximately 6.5%, extending its total pullback to around 14% from July's $1.18 peak.

911 million shares freed: Why SpaceX rallied into its own supply

The most heavily trailed supply event of the year landed on August 6, and the SpaceX (SPCX) stock went up. Roughly 911.5 million shares held by insiders and early backers became eligible to trade, around 43% more than the entire float sold at the listing.

9-3: Is the Federal Reserve’s vote tally Warsh's new forward guidance?
The rate did not move. Neither did the statement, and that’s the more interesting fact. Set the July 29 Federal Open Market Committee (FOMC) statement beside the one issued on June 17, and the two documents are identical apart from a single verb and a paragraph at the bottom naming three dissenters.