|

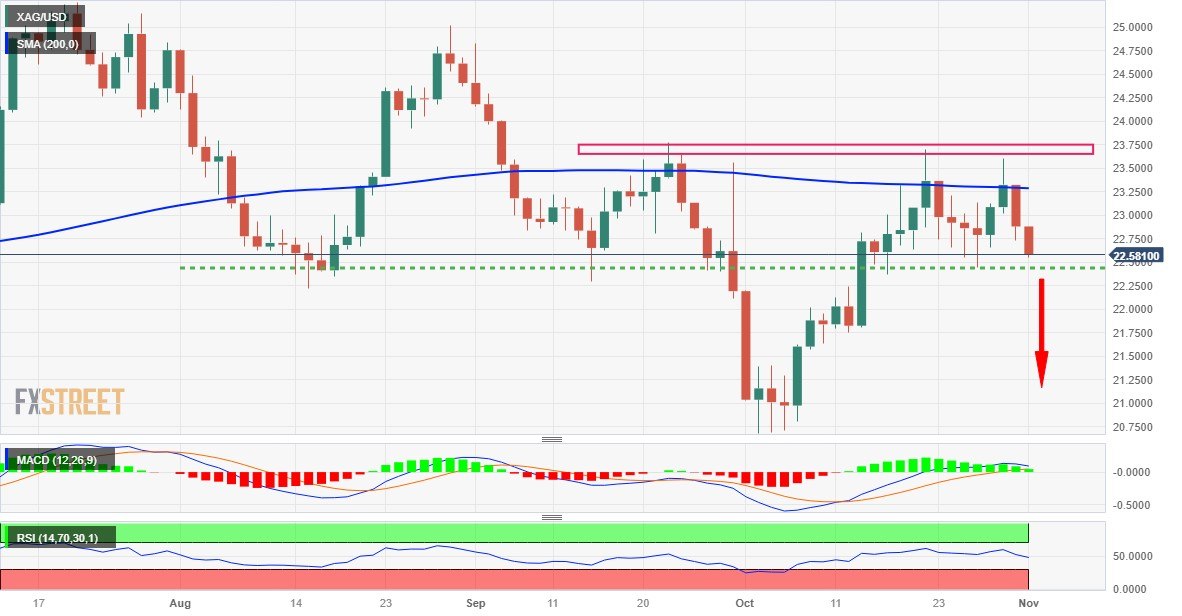
Silver Price Analysis: XAG/USD drops closer to last week’s swing low, around mid-$22.00s

  • Silver continues losing ground for the second straight day and drops to a fresh weekly low.
  • The technical setup favours bearish traders and supports prospects for a further downfall.
  • A sustained move beyond the $23.60-70 multiple tops barrier will negate the bearish bias.

Silver (XAG/USD) remains under heavy selling pressure for the second successive day on Wednesday and hits a fresh weekly low during the early part of the European session. The white metal currently trades around the $22.60-$22.55 area, down 1.30% for the day, and seems vulnerable to extending its descending trend.

From a technical perspective, the recent repeated failures to find acceptance above the 200-day Simple Moving Average (SMA) and rejections near the $23.60-$23.70 supply zone constitute the formation of a bearish multiple tops pattern. This, along with the fact that oscillators on the daily chart have again started gaining negative traction, suggests that the path of least resistance for the XAG/USD is to the downside.

Some follow-through selling below last week's swing low, around the $22.45 region, will reaffirm the bearish bias and pave the way for deeper losses. The XAG/USD might then fall to the $22.00 mark before dropping to the $21.70 horizontal support zone and the $21.35-$21.30 region. The downward trajectory could drag the white metal further towards the $21.00 mark en route to the $20.70-$20.65 area, or a seven-month low touched in October.

On the flip side, the $22.75-$22.80 congestion zone now seems to act as an immediate hurdle ahead of the $23.00 round figure. The next relevant hurdle is pegged near the $23.25 region, or the 200-day SMA, above which the XAG/USD could make a fresh attempt to clear the $23.60-$23.70 strong barrier. A convincing breakout through will be seen as a fresh trigger for bullish traders and set the stage for additional gains.

Silver daily chart

fxsoriginal

Technical levels to watch

XAG/USD

Overview
Today last price22.58
Today Daily Change-0.30
Today Daily Change %-1.31
Today daily open22.88
 
Trends
Daily SMA2022.47
Daily SMA5022.96
Daily SMA10023.23
Daily SMA20023.29
 
Levels
Previous Daily High23.33
Previous Daily Low22.74
Previous Weekly High23.36
Previous Weekly Low22.44
Previous Monthly High23.7
Previous Monthly Low20.68
Daily Fibonacci 38.2%22.96
Daily Fibonacci 61.8%23.1
Daily Pivot Point S122.63
Daily Pivot Point S222.39
Daily Pivot Point S322.04
Daily Pivot Point R123.23
Daily Pivot Point R223.58
Daily Pivot Point R323.83

Author

Haresh Menghani

Haresh Menghani is a detail-oriented professional with 10+ years of extensive experience in analysing the global financial markets.

More from Haresh Menghani
Share:

Markets move fast. We move first.

Orange Juice Newsletter brings you expert driven insights - not headlines. Every day on your inbox.

By subscribing you agree to our Terms and conditions.

Editor's Picks

EUR/USD moves sideways below 1.1800 on Christmas Eve

EUR/USD struggles to find direction and trades in a narrow channel below 1.1800 after posting gains for two consecutive days. Bond and stock markets in the US will open at the usual time and close early on Christmas Eve, allowing the trading action to remain subdued. 

GBP/USD keeps range around 1.3500 amid quiet markets

GBP/USD keeps its range trade intact at around 1.3500 on Wednesday. The Pound Sterling holds the upper hand over the US Dollar amid pre-Christmas light trading as traders move to the sidelines heading into the holiday season. 

Gold retreats from record highs, trades below $4,500

Gold retreats after setting a new record-high above $4,520 earlier in the day and trades in a tight range below $4,500 as trading volumes thin out ahead of the Christmas break. The US Dollar selling bias remains unabated on the back of dovish Fed expectations, which continues to act as a tailwind for the bullion amid persistent geopolitical risks.

Bitcoin slips below $87,000 as ETF outflows intensify, whale participation declines

Bitcoin price continues to trade around $86,770 on Wednesday, after failing to break above the $90,000 resistance. US-listed spot ETFs record an outflow of $188.64 million on Tuesday, marking the fourth consecutive day of withdrawals.

Economic outlook 2026-2027 in advanced countries: Solidity test

After a year marked by global economic resilience and ending on a note of optimism, 2026 looks promising and could be a year of solid economic performance. In our baseline scenario, we expect most of the supportive factors at work in 2025 to continue to play a role in 2026.

Avalanche struggles near $12 as Grayscale files updated form for ETF

Avalanche trades close to $12 by press time on Wednesday, extending the nearly 2% drop from the previous day. Grayscale filed an updated form to convert its Avalanche-focused Trust into an ETF with the US Securities and Exchange Commission.