|

Silver Price Analysis: XAG/USD drifts lower in a multi-week-old trading range, below 200-day SMA

  • Silver remains under some selling pressure for the second successive day on Tuesday.
  • The formation of a rectangle points to indecision over the next leg of a directional move.
  • The technical setup favours bearish traders and supports prospects for additional losses.

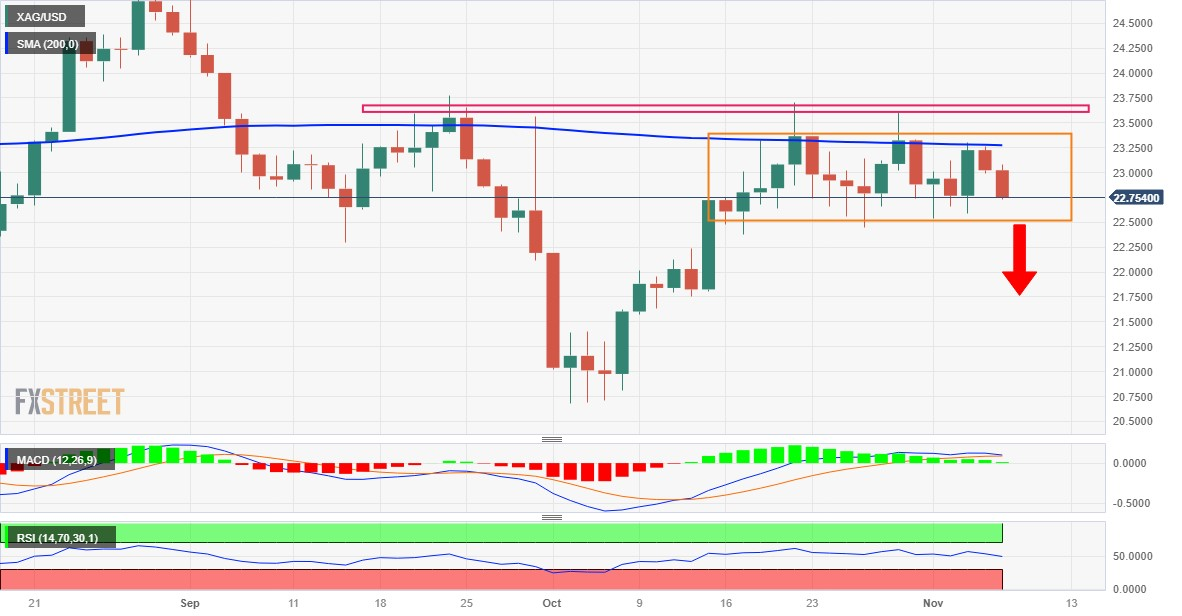
Silver (XAG/USD) extends the previous day's rejection slide from the very important 200-day Simple Moving Average (SMA) and continues losing ground for the second successive day on Tuesday. The downward trajectory picks up pace during the early part of the European session and drags the white metal to a two-day low, around the $22.75-$22.70 region in the last hour.

Looking at the broader picture, the XAG/USD has been oscillating in a familiar range over the past three weeks or so, forming a rectangle on the daily chart. This, in turn, points to indecision among traders over the next leg of a directional move. That said, the recent repeated failures to find acceptance above a technically significant 200-day SMA and rejections near the $23.60-$23.70 supply zone favour bearish traders.

Moreover, technical indicators on the daily chart have again started gaining negative traction, suggesting that the path of least resistance for the XAG/USD is to the downside. That said, it will still be prudent to wait for some follow-through selling below the $22.50 support zone before positioning for additional losses. The XAG/USD might then accelerate the fall to the $22.00 mark before dropping to the $21.70 horizontal support zone.

The downward trajectory could get extended further and drag the XAG/USD to the next relevant support near the $21.35-$21.30 region en route to the $21.00 mark. Bearish traders might then aim to challenge a seven-month low, around the $20.70-$20.65 area touched in October.

On the flip side, the $23.00  mark now seems to cap the immediate upside ahead of the 200-day SMA, currently pegged near the $23.25 region. This is followed by the $23.60-$23.70 supply zone, which should act as a key pivotal point for short-term traders. A sustained breakout through will negate the negative outlook and shift the near-term bias in favour of bullish traders, paving the way for a move towards the $24.00 mark.

Some follow-through buying has the potential to lift the XAG/USD beyond the $24.20-$24.25 intermediate resistance and make a fresh attempt to conquer the $25.00 psychological mark.

Silver daily chart

fxsoriginal

Technical levels to watch

XAG/USD

Overview
Today last price22.74
Today Daily Change-0.28
Today Daily Change %-1.22
Today daily open23.02
 
Trends
Daily SMA2022.8
Daily SMA5022.86
Daily SMA10023.19
Daily SMA20023.28
 
Levels
Previous Daily High23.26
Previous Daily Low22.99
Previous Weekly High23.61
Previous Weekly Low22.54
Previous Monthly High23.7
Previous Monthly Low20.68
Daily Fibonacci 38.2%23.09
Daily Fibonacci 61.8%23.16
Daily Pivot Point S122.92
Daily Pivot Point S222.82
Daily Pivot Point S322.65
Daily Pivot Point R123.19
Daily Pivot Point R223.36
Daily Pivot Point R323.46

Author

Haresh Menghani

Haresh Menghani is a detail-oriented professional with 10+ years of extensive experience in analysing the global financial markets.

More from Haresh Menghani
Share:

Editor's Picks

EUR/USD gains traction to near 1.1800 as tariff uncertainty weighs on US Dollar

The EUR/USD pair holds positive ground around 1.1795 during the early Asian session on Tuesday. The US Dollar weakens against the Euro amid US tariff uncertainty. The release of the US January Producer Price Index report will be in the spotlight later on Friday. 

GBP/USD treads water near 1.3500 as BoE-Fed divergence debate stalls

GBP/USD spent Monday spinning in place as market participants await a fresh catalyst to break the pair out of its recent range. The BoE's February hold came with a surprisingly dovish 5-4 split, and UK Consumer Price Index data last week showed inflation easing to 3.0%, reinforcing the case for earlier rate cuts, with most economists now looking to April or March for the next move. 

Gold falls below $5,200 amid pullback from monthly highs

Gold price is back under the $5,200 level in the Asian session on Tuesday, pulling back from the highest level in four weeks reached at $5,250 earlier on. The Gold price upsurge was fuelled by heightened geopolitical tensions and global trade uncertainty following US tariff decisions. However, an improvement in risk sentiment and a fresh US Dollar upswing trigger a corrective decline in the yellow metal. 

Solana DeFi platform Step Finance to close operations following treasury hack

The Solana based decentralized finance platform Step Finance announced it will end all operations effective immediately following a breach that drained its treasury.

Supreme Court nixes tariffs, Trump teases 15% global tariff

On February 20th, the Supreme Court ruled that Trump’s global tariffs under IEEPA authority were unconstitutional, effectively nullifying the framework. However, the relief was short-lived. Within hours, Trump floated a 15% blanket tariff under an alternative legal authority.

XRP recovers slightly as bearish sentiment dominates crypto market

Ripple is rising above $1.40 at the time of writing on Monday amid fresh tariff-triggered headwinds in the broader cryptocurrency market. The sell-off to $1.33, the token’s intraday low, can be attributed to macroeconomic uncertainty, geopolitical tensions and risk-averse sentiment among other factors.