|

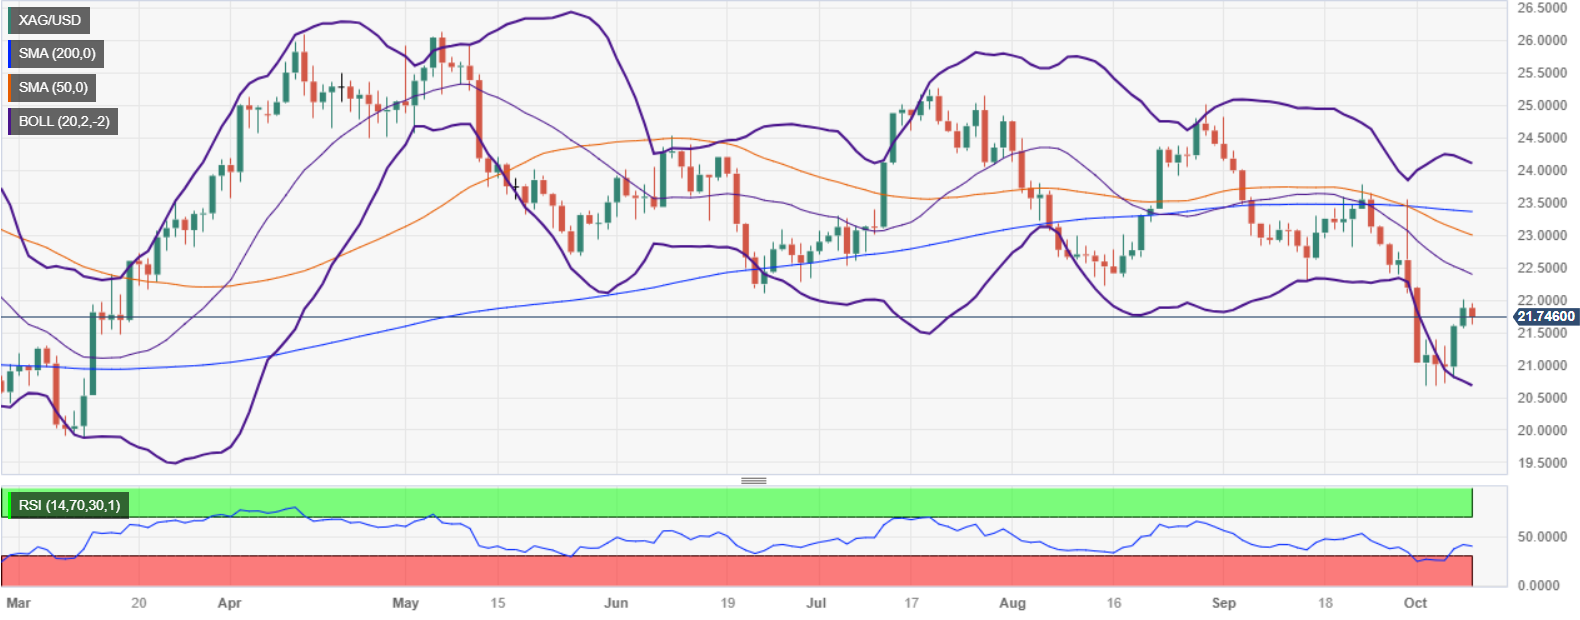
Silver Price Analysis: XAG/USD dips below $22 as bearish harami pattern looms

  • Silver price struggles beneath the $22 mark, forming a bearish 'harami' pattern on daily charts.
  • Potential bearish continuation looms, with sights set on the October 9 low of $21.57.
  • Recovery above $22.00 necessitates claiming $22.11, with subsequent hurdles noted at 20-day EMA.

Silver price (XAG/USD) loses some of its bright, retreats from around weekly highs of $22.01 and is back below the figure, exchanging hands at around $21.75, even though US Treasury bond yields continued to extend their losses.

The daily chart portrays the white metal was shy of reclaiming the June 23 swing low of $23.11, but failure to do it, exacerbated selling pressure at around the $22.00 mark. Consequently, XAG/USD dropped and is forming a two-candlestick bearish pattern, called a ‘bearish-harami’, the equivalent of an ‘inside day.’ A bearish continuation would happen, once Silver price slides below the October 9 swing low of $21.57, putting into play a test of the year-to-date (YTD) low of $19.90.

On the other hand, if XAG/USD recovers the $22.00 figure, buyers must claim a June 23 low of $22.11. A breach of the latter will expose the 20-day Exponential Moving Average (EMA) at $22.38 before testing the 50-day moving average (DMA) at $22.98.

XAG/USD Price Action – Daily chart

XAG/USD Technical Levels

XAG/USD

Overview
Today last price21.75
Today Daily Change-0.13
Today Daily Change %-0.59
Today daily open21.88
 
Trends
Daily SMA2022.46
Daily SMA5023.05
Daily SMA10023.36
Daily SMA20023.38
 
Levels
Previous Daily High22.02
Previous Daily Low21.57
Previous Weekly High22.2
Previous Weekly Low20.68
Previous Monthly High24.82
Previous Monthly Low22.12
Daily Fibonacci 38.2%21.85
Daily Fibonacci 61.8%21.74
Daily Pivot Point S121.63
Daily Pivot Point S221.38
Daily Pivot Point S321.19
Daily Pivot Point R122.08
Daily Pivot Point R222.27
Daily Pivot Point R322.52

Author

Christian Borjon Valencia

Markets analyst, news editor, and trading instructor with over 14 years of experience across FX, commodities, US equity indices, and global macro markets.

More from Christian Borjon Valencia
Share:

Editor's Picks

AUD/USD stays bid above 0.7100 on Australian trade data, Mideast optimism

AUD/USD clings to minor recovery gains above 0.7100 in the Asian session on Thursday as a new Israel-Lebanon ceasefire keeps a lid on the safe-haven US Dollar. Meanwhile, strong AustralianTrade Balane data also help the Aussie pair sustain the bounce from weekly lows.

USD/JPY hovers near the 160.00 intervention threshold on Mideast tensions

USD/JPY struggles to find acceptance above 160.00 and retreats from a one-month high in the Asian session on Thursday amid fears that authorities will step in again to prop up the Japanese Yen. Furthermore, a new Israel-Lebanon ceasefire caps the US Dollar and supports the currency pair. However, renewed US-Iran tensions keep the downside limited in the Greenback and the pair.

Gold rebounds from one-week low as Israel-Lebanon truce pressures safe-haven USD

Gold gains some positive traction on Thursday and climbs to the $4,475 area during the Asian session, reversing a major part of the previous day's slide to a one-week low. The Israel-Lebanon truce prompts some profit-taking around the US Dollar and supports the commodity. 


Ethereum: Long-term holders' capitulation drives ETH below $1,800

Ethereum has fallen below $1,800 on Wednesday, the first time since May 2025 following accelerated spot selling pressure and distributions from long-term holders. The Age Consumed metric, which tracks the movement of previously idle tokens or long-term holders' coins, spiked over the past two days as prices declined, indicating increased selling activity among this cohort.

Kevin Warsh takes the Fed helm: What it means for the US Dollar
The Federal Reserve moves away from the highly predictable "forward guidance" model of the Jerome Powell era to a new “Kevin Warsh environment”, characterized by less communication, more policy surprises, and an increased focus on the Fed's complex balance sheet.
Recession on paper: What really moves the Canadian Loonie now?

Statistics Canada handed the headline writers a gift and the analysts a headache. Real GDP shrank 0.1% on an annualized basis in the first quarter, and with the fourth quarter of 2025 revised down to a 1.0% contraction, that is two negative quarters in a row, the textbook definition of a technical recession and Canada's first since the pandemic.