|

Silver Price Analysis: XAG/USD could retest sub-$22.00 levels, or two-month trough

  • Silver struggles to capitalize on the previous day’s modest bounce from a two-week low.
  • The technical setup favours bearish traders and supports prospects for additional losses.
  • A sustained strength beyond the 200-day SMA is needed to negate the bearish outlook.

Silver (XAG/USD) attracts some sellers following an intraday uptick on Thursday and for now, seems to have stalled its modest recovery from the $22.30-$22.25 region, or a two-week low touched the previous day. The white metal trades just below the mid-$22.00s during the first half of the European session and seems vulnerable to sliding further.

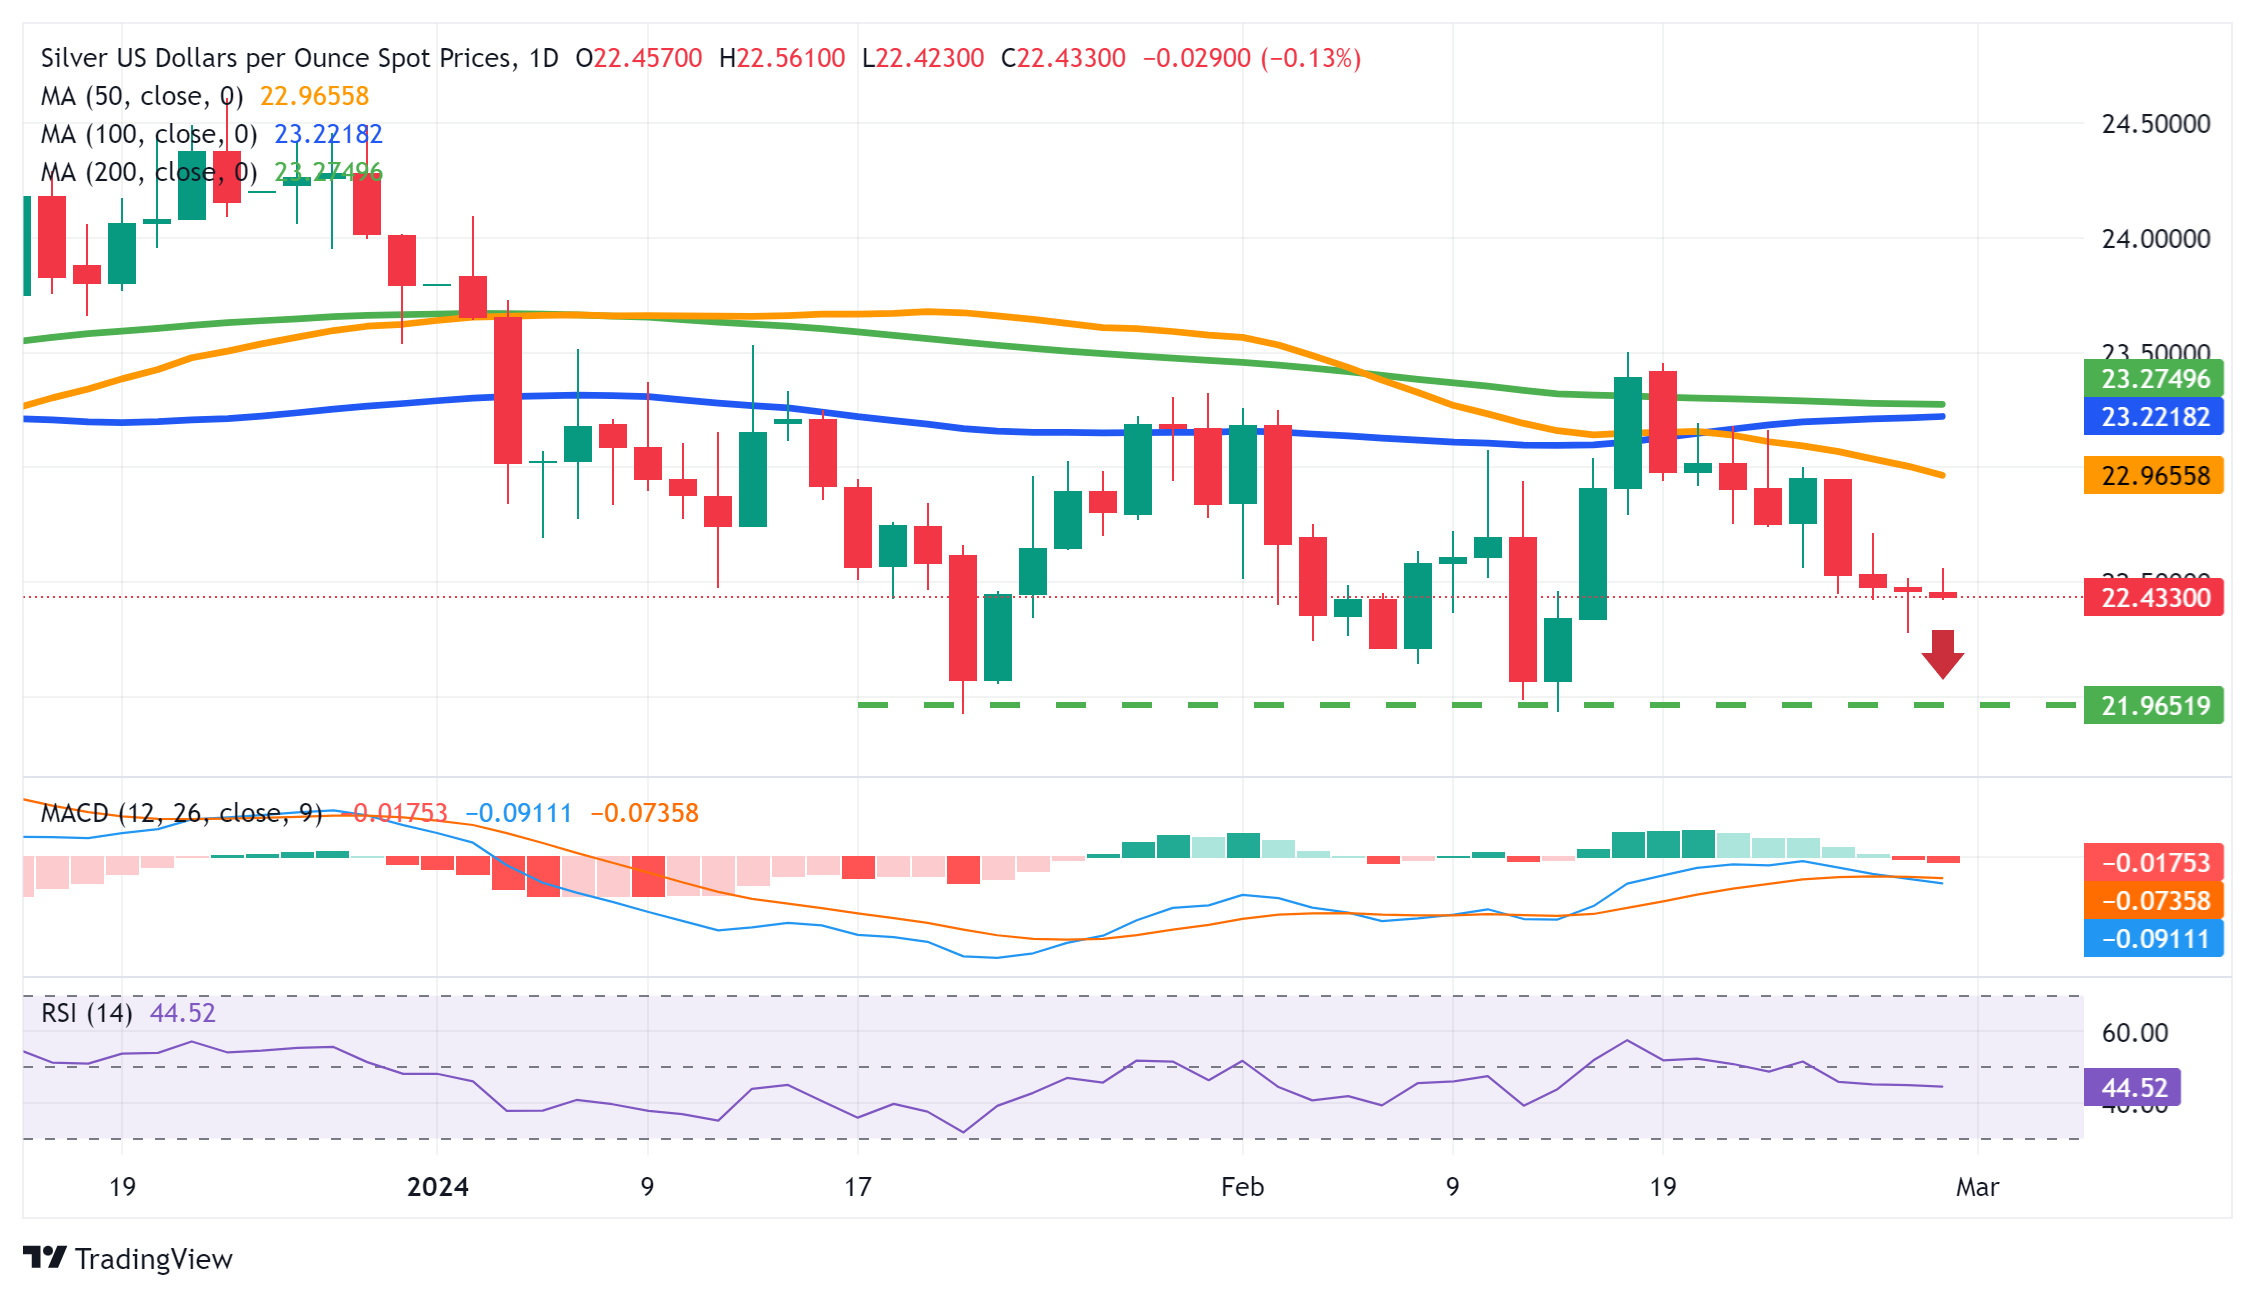
The recent failure to find acceptance above the very important and significant 200-day Simple Moving Average (SMA) and the subsequent slide from a multi-week high, around mid-$23.00s touched on February 16, validates the negative outlook. Moreover, oscillators on the daily chart have just started drifting in the negative territory and support prospects for a further near-term depreciating move for the XAG/USD.

That said, it will still be prudent to wait for some follow-through selling below the overnight swing low, around the $22.30$22.25 area before placing fresh bearish bets. The XAG/USD might then accelerate the fall towards retesting sub-$22.00 levels, or a two-month low touched in January. The downward trajectory could extend further and drag the white metal to the next relevant support near the $21.40-$21.35 region.

On the flip side, the daily peak, around the mid-$22.00s, might continue to act as an immediate hurdle ahead of the $22.70-$22.75 region. This is followed by the $23.00 round-figure mark, which if cleared decisively might trigger a short-covering rally, though the momentum runs the risk of fizzling out near the 200-day SMA, currently around the $23.30 zone. This should cap the upside near the mid-$23.00, or the monthly peak.

Silver daily chart

fxsoriginal

XAG/USD

Overview
Today last price22.46
Today Daily Change0.00
Today Daily Change %0.00
Today daily open22.46
 
Trends
Daily SMA2022.68
Daily SMA5023
Daily SMA10023.22
Daily SMA20023.28
 
Levels
Previous Daily High22.52
Previous Daily Low22.28
Previous Weekly High23.46
Previous Weekly Low22.56
Previous Monthly High24.09
Previous Monthly Low21.93
Daily Fibonacci 38.2%22.37
Daily Fibonacci 61.8%22.43
Daily Pivot Point S122.32
Daily Pivot Point S222.18
Daily Pivot Point S322.08
Daily Pivot Point R122.56
Daily Pivot Point R222.66
Daily Pivot Point R322.8

Author

Haresh Menghani

Haresh Menghani is a detail-oriented professional with 10+ years of extensive experience in analysing the global financial markets.

More from Haresh Menghani
Share:

Editor's Picks

GBP/USD slides below 1.3250 after failing to break through 23.6% Fibo

The GBP/USD pair meets with a fresh supply during the Asian session on Wednesday and moves away from a nearly two-week high around the 1.3275 region, touched the previous day. Spot prices currently trade around the 1.3235 zone, down 0.20% for the day, as traders look to speeches from Bank of England Governor Andrew Bailey and Federal Reserve Chair Kevin Warsh for a fresh impetus.

EUR/USD keeps losses near 1.1400 ahead of Eurozone inflation data

EUR/USD keeps the offered tone intact near 1.1400 in early Europe on Wednesday, pressured by receding bets for aggressive tightening by the European Central Bank (ECB). Traders will take more cues from the preliminary reading of the Eurozone's Harmonized Index of Consumer Prices and the US Manufacturing PMI report due later in the day.

Gold sticks to bearish bias below $4,000 amid Fed hike bets and Iran risks

Gold attracts fresh sellers following the previous day's good two-way price swings, and weakens further below the $4,000 psychological mark through the Asian session. This marks the third straight day of a slide and keeps the precious metal closer to its lowest level since November 2025. Moreover, a bullish US Dollar suggests that the path of least resistance for the bullion is to the downside.

Solana: Retail confidence backs SOL testing 50-day EMA breakout near $75

Solana price extends gains, testing the 50-day Exponential Moving Average around $75.00. Although institutional demand for Solana remains weak, stabilizing retail confidence, with rising funding rates and steady Open Interest, supports the mild recovery. The technical outlook for SOL shifts mildly bullish, projecting a potential breakout rally toward the $100 mark.

Kevin Warsh isn't expected to say much in Sintra: That's exactly why markets will listen

Financial markets could find an important catalyst in the enchanting, fairytale-like landscape of  Sintra this week. The European Central Bank Forum will, as it does every year, gather the crème de la crème of central banks. The new boss at the Federal Reserve, who has clearly said that the Fed should stop explaining everything, will need to talk – and traders should listen.

Kevin Warsh isn't expected to say much in Sintra: That's exactly why markets will listen

Financial markets could find an important catalyst in the enchanting, fairytale-like landscape of Sintra this week. The ECB Forum will, as it does every year, gather the crème de la crème of central banks. The new boss at the Fed, who has clearly said that the Fed should stop explaining everything, will need to talk – and traders should listen.