|

Silver Price Analysis: XAG/USD corrects further from over two-month top, bullish bias remains

  • Silver edges lower and retreat further from over a two-month peak touched on Friday.
  • The technical setup supports prospects for the emergence of dip-buying at lower levels.
  • A sustained move beyond a descending trend line is needed to reaffirm the positive bias.

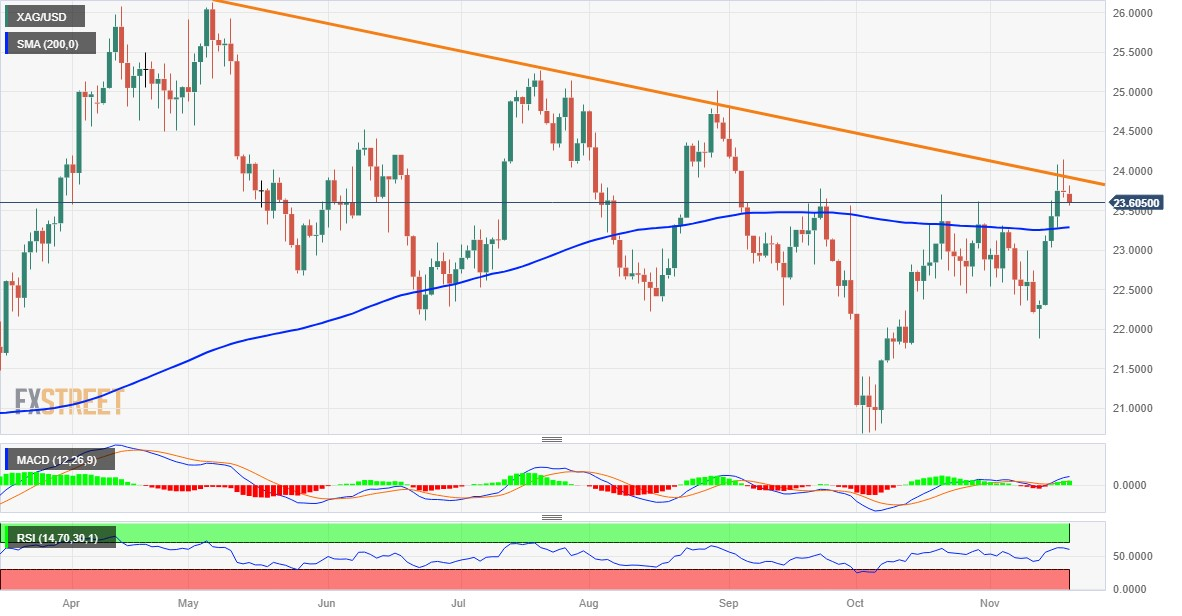
Silver (XAG/USD) extends Friday's retracement slide from the $24.15 region, or its highest level since September 4 and remains under some selling pressure on the first day of a new week. The white metal remains depressed through the early part of the European session and currently trades around the $23.65-$23.60 area, down nearly 0.50% for the day.

From a technical perspective, last week's breakout momentum through the very important 200-day Simple Moving Average (SMA) falters near a resistance marked by a downward sloping trend line extending from the May monthly swing high. The said barrier, currently around the $24.00 round figure, should now act as a key pivotal point for the XAG/USD and help determine the next leg of a directional move.

Oscillators on the daily chart, meanwhile, are holding in the positive territory and are still far from being in the overbought zone. This, in turn, suggests that the path of least resistance for the XAG/USD is to the upside and supports prospects for the emergence of some dip-buying at lower levels. Bulls, however, need to wait for acceptance above the $24.00 mark before placing fresh bets and positioning for further gains.

The XAG/USD might then aim to surpass the $24.20-$24.25 intermediate resistance and make a fresh attempt to conquer the $25.00 psychological mark. Some follow-through buying beyond the $25.15-$25.20 region should set the stage for a more towards reclaiming the $26.00 round figure for the first time since May.

On the flip side, the 200-day SMA, currently pegged near the $23.30 region, now seems to protect the immediate downside. Any further decline could be seen as a buying opportunity and remain limited near the $23.00 mark. That said, a convincing break below the latter might prompt aggressive technical selling and drag the XAG/USD further towards the $22.35-$22.30 zone en route to the $22.00 mark.

Silver daily chart

fxsoriginal

Technical levels to watch

XAG/USD

Overview
Today last price23.63
Today Daily Change-0.10
Today Daily Change %-0.42
Today daily open23.73
 
Trends
Daily SMA2022.96
Daily SMA5022.69
Daily SMA10023.22
Daily SMA20023.28
 
Levels
Previous Daily High24.15
Previous Daily Low23.66
Previous Weekly High24.15
Previous Weekly Low21.88
Previous Monthly High23.7
Previous Monthly Low20.68
Daily Fibonacci 38.2%23.85
Daily Fibonacci 61.8%23.96
Daily Pivot Point S123.55
Daily Pivot Point S223.37
Daily Pivot Point S323.07
Daily Pivot Point R124.03
Daily Pivot Point R224.33
Daily Pivot Point R324.51

Author

Haresh Menghani

Haresh Menghani is a detail-oriented professional with 10+ years of extensive experience in analysing the global financial markets.

More from Haresh Menghani
Share:

Editor's Picks

GBP/USD bounces off lows, back above 1.3200

After bottoming out near 1.3160, GBP/USD manages to regain a bit of shine and reclaim the 1.3200 mark and beyond at the end of the week. Stronger-than-expected UK Retail Sales data seem to be helping the British Pound limit its losses, while the chaotic UK political environment keeps the bulls at bay for now.

EUR/USD looks consolidative around 1.1460

EUR/USD stages a modest rebound after slipping to a three-month low below 1.1420 at the end of the week. That said, the pair now looks to consolidate humble gains just above 1.1460 despite growing uncertainty surrounding the next round of US-Iran negotiations, which keeps the US Dollar’s downside contained.

Gold slips back to six-day lows, targets $4,100

Gold retreats for the third consecutive day on Friday, eroding gains seen in the first half of the week and approaching the key $4,100 mark per troy ounce. Indeed, the precious metal continues to face headwinds from the Fed's hawkish stance and renewed uncertainty surrounding the next round of US-Iran negotiations.

Solana extends correction despite ETF inflows, RWA adoption

Solana (SOL) price edges below $70 extending its losses for the fourth straight day this week. The institutional demand for Solana is building, with steady inflows so far this week and Morgan Stanley’s amended S-1 filing for a Solana-focused Exchange-Traded Fund.

The Iran war didn't break the US economy, but what happens next?

Nearly four months after the start of the Iran war, the US economy remains remarkably resilient. While the conflict initially triggered a severe disruption to global energy markets and a sharp rise in Oil prices, recent diplomatic progress between Washington and Tehran has eased concerns about a prolonged supply shock.

Regime change: Inside Kevin Warsh's first move to make the Fed unreadable on purpose

The rate did not move. That was the least interesting thing about Kevin Warsh's first meeting in charge of the Fed. The FOMC held its benchmark at 3.50%-3.75% for the fourth straight meeting, exactly as priced, and then the new chair used his first press conference to dismantle the machinery the market has leaned on for a decade.