|

Silver Price Analysis: XAG/USD consolidates around $25.00, bullish bias remains

  • Silver lacked any firm direction and remained confined in a range around the $25.00 mark.
  • The set-up favours bullish traders and supports prospects for a further appreciating move.
  • Sustained weakness below the trend-channel support is needed to negate the positive bias.

Silver struggled to capitalize on the previous day's positive move and seesawed between tepid gains/minor losses heading into the North American session. The white metal was last seen trading flat, around the key $25.00 psychological mark.

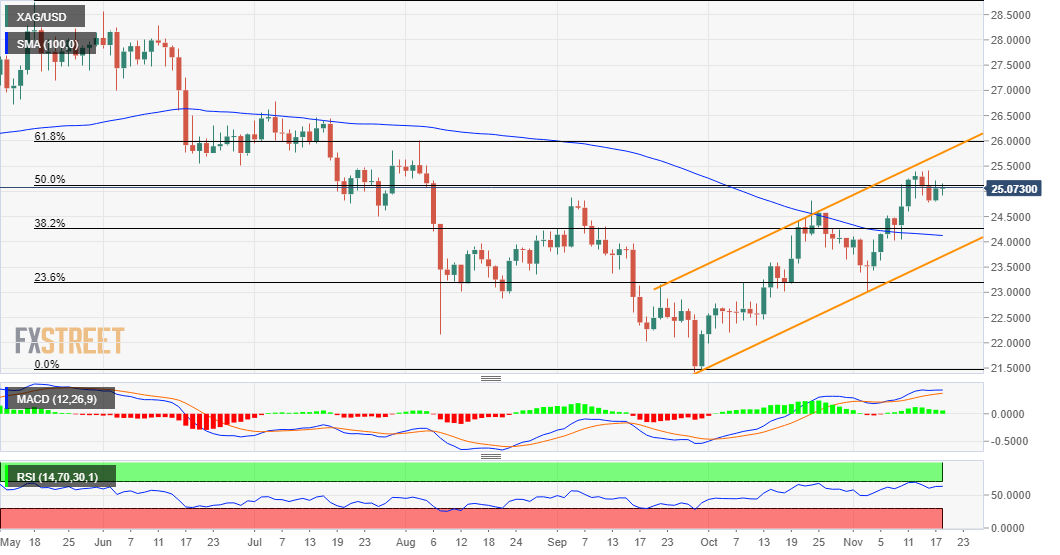
Looking at the broader technical picture, the recent strong recovery from the YTD low touched in September has been along an ascending channel. This, along with last week's breakthrough the 100-day SMA/38.2% Fibo. confluence barrier favours bullish traders.

The positive bias is reinforced by the emergence of fresh buying on Wednesday and bullish oscillators on the daily chart, which are still away from being in the overbought territory. The set-up supports prospects for a further near-term appreciating move.

That said, the metal's inability to find acceptance above the 50% Fibonacci level of the $28.75-$21.42 slide warrants caution. Nevertheless, the stage seems all set for a move towards testing the next relevant hurdle near the $25.55-60 region.

Some follow-through buying has the potential to lift the XAG/USD towards the 61.8% Fibo. level, around the $26.00 round-figure mark. This coincides with the top boundary of the mentioned ascending channel and should cap any further gains. 

On the flip side, any pullback might still be seen as a buying opportunity and remain limited near the $24.50 resistance breakpoint. This is followed by the $24.10-$24.00 confluence (100-DMA and the 38.2% Fibo. level, ahead of the trend-channel support near the $23.85-80 region.

A convincing break below the latter will negate the constructive outlook, rather shift the bias back in favour of bearish traders and prompt aggressive technical selling. The XAG/USD might then accelerate the slide towards the $23.00 mark, or the 23.6% Fibo. level.

Silver daily chart

fxsoriginal

Technical levels to watch

XAG/USD

Overview
Today last price25.04
Today Daily Change-0.02
Today Daily Change %-0.08
Today daily open25.06
 
Trends
Daily SMA2024.37
Daily SMA5023.5
Daily SMA10024.13
Daily SMA20025.34
 
Levels
Previous Daily High25.21
Previous Daily Low24.8
Previous Weekly High25.39
Previous Weekly Low24.03
Previous Monthly High24.83
Previous Monthly Low22
Daily Fibonacci 38.2%25.05
Daily Fibonacci 61.8%24.96
Daily Pivot Point S124.84
Daily Pivot Point S224.62
Daily Pivot Point S324.43
Daily Pivot Point R125.24
Daily Pivot Point R225.43
Daily Pivot Point R325.65

Author

Haresh Menghani

Haresh Menghani is a detail-oriented professional with 10+ years of extensive experience in analysing the global financial markets.

More from Haresh Menghani
Share:

Editor's Picks

AUD/USD eyes 0.7150 barrier nine-day EMA

AUD/USD inches higher after registering modest losses in the previous day, trading around 0.7130 during the Asian hours. The technical analysis of the daily chart indicates that the pair is moving sideways within the rectangle pattern, suggesting a consolidation as neither the bulls nor the bears have enough momentum to take control of the market.

USD/JPY trades below 160.00 intervention threshold; bullish bias intact

The USD/JPY pair attracts some sellers during the Asian session amid fears that authorities will step in again to prop up the Japanese Yen. Furthermore, the Israel-Lebanon truce prompts some profit-taking around the US Dollar and exerts downward pressure on the currency pair.

Gold defends 200-day SMA, rises toward $4,500

Gold is attempting a tepid recovery toward $4,500 on Thursday, as renewed optimism in the Mideast geopolitical front calms market nerves. This cautious optimism across Asian markets weighs on Oil prices, and diminishes the US Dollar’s safe-haven appeal, helping Gold stage a decent comeback from the weekly low of $4,424.


Hyperliquid: ETF demand, capital rotation fuel HYPE rally as Bitcoin melts

Hyperliquid price sustains an upward trend near its all-time high of $75.76 on Thursday after posting 80% gains in May, while Bitcoin (BTC) retraces below $65,000, triggering a market-wide panic.

Kevin Warsh takes the Fed helm: What it means for the US Dollar
The Federal Reserve moves away from the highly predictable "forward guidance" model of the Jerome Powell era to a new “Kevin Warsh environment”, characterized by less communication, more policy surprises, and an increased focus on the Fed's complex balance sheet.
Recession on paper: What really moves the Canadian Loonie now?

Statistics Canada handed the headline writers a gift and the analysts a headache. Real GDP shrank 0.1% on an annualized basis in the first quarter, and with the fourth quarter of 2025 revised down to a 1.0% contraction, that is two negative quarters in a row, the textbook definition of a technical recession and Canada's first since the pandemic.