|

Silver Price Analysis: XAG/USD climbs more than 0.50%, eyes $30.00

  • Silver trades and gains 0.60% after touching a daily low of $29.35.
  • Momentum is neutral, with RSI around the 50-neutral line, suggesting buyers and sellers are balanced.
  • Key resistance at $30.25 and $31.54, with support levels at $29.05 and $28.66.

Silver climbed during the North American session, gaining more than 0.60% amid thin trading liquidity conditions. Wall Street remained closed in observance of the Juneteenth holiday. The XAG/USD trades at $29.71 after hitting a daily low of $29.35.

XAG/USD Price Analysis: Technical analysis

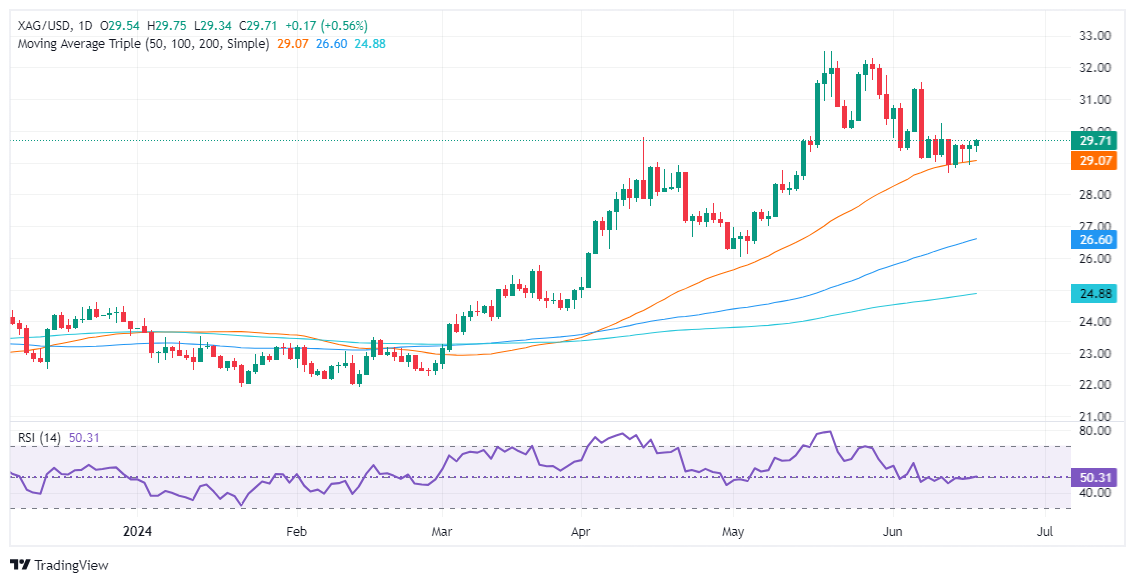
The grey metal remains neutral to upward bias, despite diving from year-to-date (YTD) highs reached at $32.51, below the $30.00 figure. Silver seems to have bottomed after hitting a monthly low of $28.66; since then, XAG/USD edged higher, and it’s shy of challenging the $30.00 mark.

Momentum shows that neither buyers nor sellers are in charge, as the Relative Strength Index (RSI) hovers around the 50-neutral line.

The most likely scenario would be a bullish continuation if XAG/USD buyers reclaim $30.00, which could reignite Silver’s rally and pave the way for further upside. The next resistance level would be the June 12 high at $30.25, followed by the month-to-date (MTD) high of $31.54, the June 7 peak. A breach of the latter will expose the YTD high of $32.51.

On the other hand, if XAG/USD sellers drag spot prices below the 50-day moving average (DMA) at $29.05, it will expose $29.00. Once cleared, that could expose the MTD low of $28.66, ahead of plunging toward the 100-DMA at $26.60.

XAG/USD Price Action – Daily Chart

XAG/USD

Overview
Today last price29.71
Today Daily Change0.17
Today Daily Change %0.58
Today daily open29.54
 
Trends
Daily SMA2030.29
Daily SMA5029.03
Daily SMA10026.54
Daily SMA20024.84
 
Levels
Previous Daily High29.68
Previous Daily Low28.93
Previous Weekly High30.26
Previous Weekly Low28.66
Previous Monthly High32.51
Previous Monthly Low26.02
Daily Fibonacci 38.2%29.39
Daily Fibonacci 61.8%29.22
Daily Pivot Point S129.09
Daily Pivot Point S228.63
Daily Pivot Point S328.33
Daily Pivot Point R129.84
Daily Pivot Point R230.14
Daily Pivot Point R330.59

Author

Christian Borjon Valencia

Markets analyst, news editor, and trading instructor with over 14 years of experience across FX, commodities, US equity indices, and global macro markets.

More from Christian Borjon Valencia
Share:

Editor's Picks

AUD/USD eyes 0.7150 barrier nine-day EMA

AUD/USD inches higher after registering modest losses in the previous day, trading around 0.7130 during the Asian hours. The technical analysis of the daily chart indicates that the pair is moving sideways within the rectangle pattern, suggesting a consolidation as neither the bulls nor the bears have enough momentum to take control of the market.

USD/JPY trades below 160.00 intervention threshold; bullish bias intact

The USD/JPY pair attracts some sellers during the Asian session amid fears that authorities will step in again to prop up the Japanese Yen. Furthermore, the Israel-Lebanon truce prompts some profit-taking around the US Dollar and exerts downward pressure on the currency pair.

Gold puts its 200-day SMA to the test near $4,420

Gold keeps the bullish stance in place in the latter part of Thursday’s session, although a convincing break above the key $4,500 mark per troy ounce still remains elusive. The precious metal’s advance comes amid the resurgence of some selling interest around the Greenback, improving risk sentiment, and declining US Treasury yields across the board.

Bitcoin’s massive storm is back: Why the sell-off is far from over

Bitcoin price action over the last few weeks has felt less like a normal, healthy correction and more like a slow grinding crash that continues to wreak havoc on holdings and trading accounts. And everything suggests that the dramatic crash isn’t over.

Nonfarm payrolls: Testing the limits of Fed policy patience

The upcoming nonfarm payrolls report for May will provide the final update on the US labor market before Kevin Warsh attends his first policy meeting as the new Fed Chair later this month.

Recession on paper: What really moves the Canadian Loonie now?

Statistics Canada handed the headline writers a gift and the analysts a headache. Real GDP shrank 0.1% on an annualized basis in the first quarter, and with the fourth quarter of 2025 revised down to a 1.0% contraction, that is two negative quarters in a row, the textbook definition of a technical recession and Canada's first since the pandemic.