Silver Price Analysis: XAG/USD challenges 21-DMA on the road to recovery
- Silver rebounds to test 21-DMA after a three-day losing streak.
- XAG/USD wavers within a symmetrical triangle on the 1D chart.
- Risks remain skewed to the upside amid bullish RSI.

Silver price (XAG/USD) is snapping a three-day downtrend, rebounding towards the $28 mark, as the attention turns towards the FOMC monetary policy decision.
The Fed is likely to points to tapering plans in the coming month, which could lift the US dollar’s demand at silver’s expense.
However, the technical setup on the daily chart is constructing a brighter outlook for the white metal in the near term.
Silver price is on track to recapture the $28 threshold, although it needs a sustained break above the 21-Daily Moving Average (DMA) at $27.81 to extend the recovery momentum.
If the $28 round number is cracked, silver bulls will then yearn for acceptance above the falling trendline resistance at $28.23.
A symmetrical triangle breakout will get validated on a daily closing above the latter.
The Relative Strength Index (RSI) is edging higher above the midline, allowing room for more upside.
Silver Price Chart: Daily chart
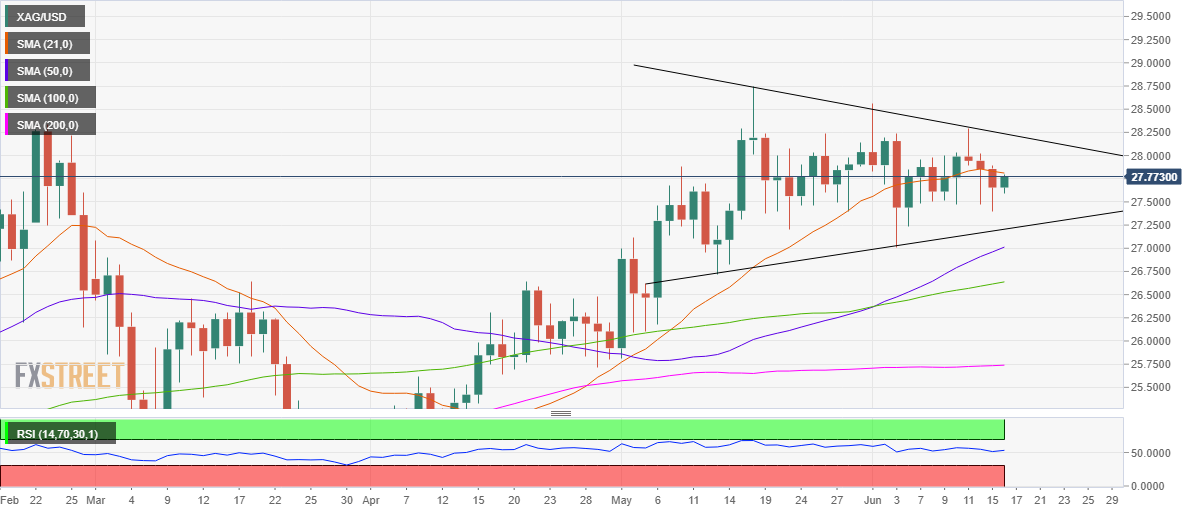
Alternatively, silver bears will resume the bearish momentum on rejection at the 21-DMA barrier.
Tuesday’s low at $27.39 could offer some support to the buyers, below which the rising trendline support at $27.20 could be put at risk.
All in all, silver price is likely to maintain its price action within a $1 range, with eyes on the FOMC verdict.
A breakout from the said range in either direction could trigger sharp moves in silver.
Silver Additional levels
Author

Dhwani Mehta
FXStreet
Residing in Mumbai (India), Dhwani is a Senior Analyst and Manager of the Asian session at FXStreet. She has over 10 years of experience in analyzing and covering the global financial markets, with specialization in Forex and commodities markets.
















