|

Silver Price Analysis: XAG/USD bulls need validation from $24.80 and US data

  • Silver Price struggles with the key upside hurdle at monthly high.
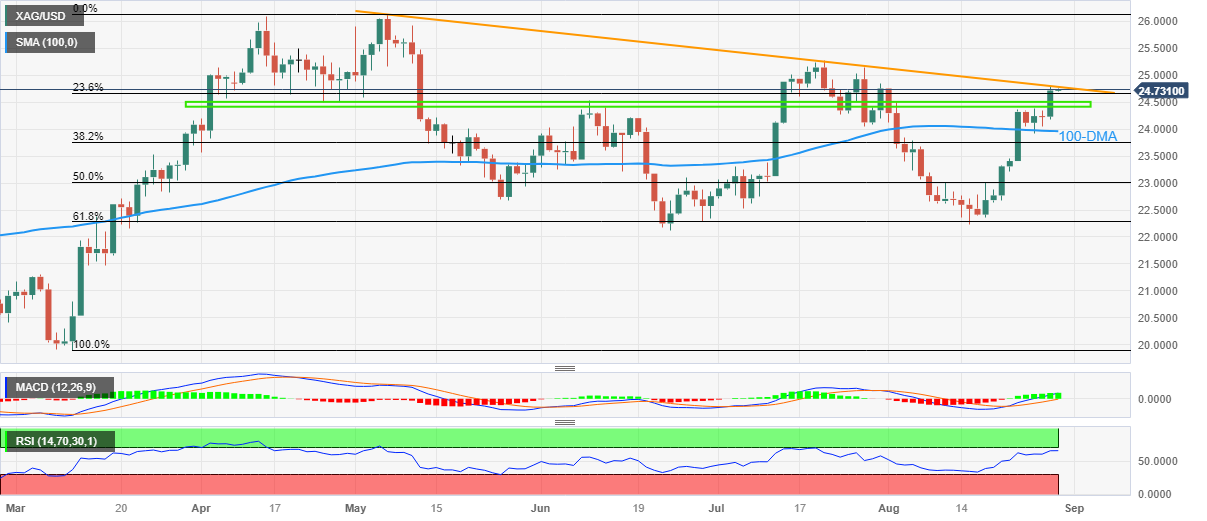
  • Descending resistance line from early May challenges XAG/USD bulls amid nearly overbought RSI (14) line.
  • Clear upside break of four-month-old horizontal resistance area, bullish MACD signals favor Silver buyers.
  • 100-DMA, key Fibonacci retracement levels can prod XAG/USD pullback.

Silver Price (XAG/USD) remains sidelined near $24.70–75 during early Wednesday as bulls jostle with the key upside hurdle ahead of the US data.

It’s worth noting that the nearly overbought RSI joins a 16-week-old falling resistance line surrounding $24.80 to challenge the XAG/USD buyers.

However, the bullish MACD signals a daily closing beyond the four-month-long horizontal resistance zone, now immediate support around $24.50–40, which will test the Silver sellers.

Following that, the 100-DMA support of around $23.95 will precede the 50% and 61.8% Fibonacci retracements of March–May upside, respectively near $23.00 and $22.30, to offer a bumpy ride to the XAG/USD bears.

Meanwhile, a daily closing beyond the aforementioned resistance line of around $24.80 needs support from the US ADP Employment Change, the final readings of the US second quarter (Q2) Gross Domestic Product (GDP) and the Personal Consumption Expenditure (PCE).

Should the softer US data join the Silver Price upside beyond the immediate resistance line, the bulls can challenge the previous monthly high of around $25.30 ahead of targeting the yearly high marked in May at around $26.15.

Silver Price: Daily chart

Trend: Pullback expected

Additional important levels

Overview
Today last price24.72
Today Daily Change0.00
Today Daily Change %0.00%
Today daily open24.72
 
Trends
Daily SMA2023.31
Daily SMA5023.56
Daily SMA10023.97
Daily SMA20023.39
 
Levels
Previous Daily High24.8
Previous Daily Low24.18
Previous Weekly High24.38
Previous Weekly Low22.67
Previous Monthly High25.27
Previous Monthly Low22.52
Daily Fibonacci 38.2%24.56
Daily Fibonacci 61.8%24.41
Daily Pivot Point S124.33
Daily Pivot Point S223.94
Daily Pivot Point S323.71
Daily Pivot Point R124.95
Daily Pivot Point R225.18
Daily Pivot Point R325.57

Author

Anil Panchal

Anil Panchal

FXStreet

Anil Panchal has nearly 15 years of experience in tracking financial markets. With a keen interest in macroeconomics, Anil aptly tracks global news/updates and stays well-informed about the global financial moves and their implications.

More from Anil Panchal
Share:

Editor's Picks

EUR/USD treads water above 1.1850 amid thin trading

EUR/USD stays defensive but holds 1.1850 amid quiet markets in the European hours on Monday.  The US Dollar is struggling for direction due to thin liquidity conditions as US markets are closed in observance of Presidents' Day. 

GBP/USD flat lines as traders await key UK and US macro data

GBP/USD kicks off a new week on a subdued note and oscillates in a narrow range near 1.365 in Monday's European trading. The mixed fundamental backdrop warrants some caution for aggressive traders as the market focus now shifts to this week's important releases from the UK and the US.

Gold slides below $5,000 amid USD uptick and positive risk tone; downside seems limited

Gold attracts fresh sellers at the start of a new week and reverses a part of Friday's strong move up of over $150 from sub-$4,900 levels. The commodity slides back below the $5,000 psychological mark during the Asian session, though the downside potential seems limited amid a combination of supporting factors.

Bitcoin, Ethereum and Ripple consolidate within key ranges as selling pressure eases

Bitcoin and Ethereum prices have been trading sideways within key ranges following the massive correction. Meanwhile, XRP recovers slightly, breaking above the key resistance zone. The top three cryptocurrencies hint at a potential short-term recovery, with momentum indicators showing fading bearish signs.

Global inflation watch: Signs of cooling services inflation

Realized inflation landed close to expectations in January, as negative base effects weighed on the annual rates. Remaining sticky inflation is largely explained by services, while tariff-driven goods inflation remains limited even in the US.

Ripple Price Forecast: XRP potential bottom could be in sight

Ripple edges up above the intraday low of $1.35 at the time of writing on Friday amid mixed price actions across the crypto market. The remittance token failed to hold support at $1.40 the previous day, reflecting risk-off sentiment amid a decline in retail and institutional sentiment.