Silver Price Analysis: XAG/USD bulls have the upper hand while above 100-day SMA support
- Silver lacks any firm intraday direction and consolidates in a range on Wednesday.
- The technical setup favors bulls and supports prospects for some meaningful gains.
- A break below the 100-day SMA pivotal support would negate the positive outlook.

Silver (XAG/USD) struggles to capitalize on the previous day's goodish rebound from the $31.25 area, or over a one-week low, and oscillates in a narrow band through the first half of the European session on Wednesday. The white metal currently trades below the $32.00 mark, unchanged for the day, as traders opt to wait for the release of the US consumer inflation figures before placing directional bets.
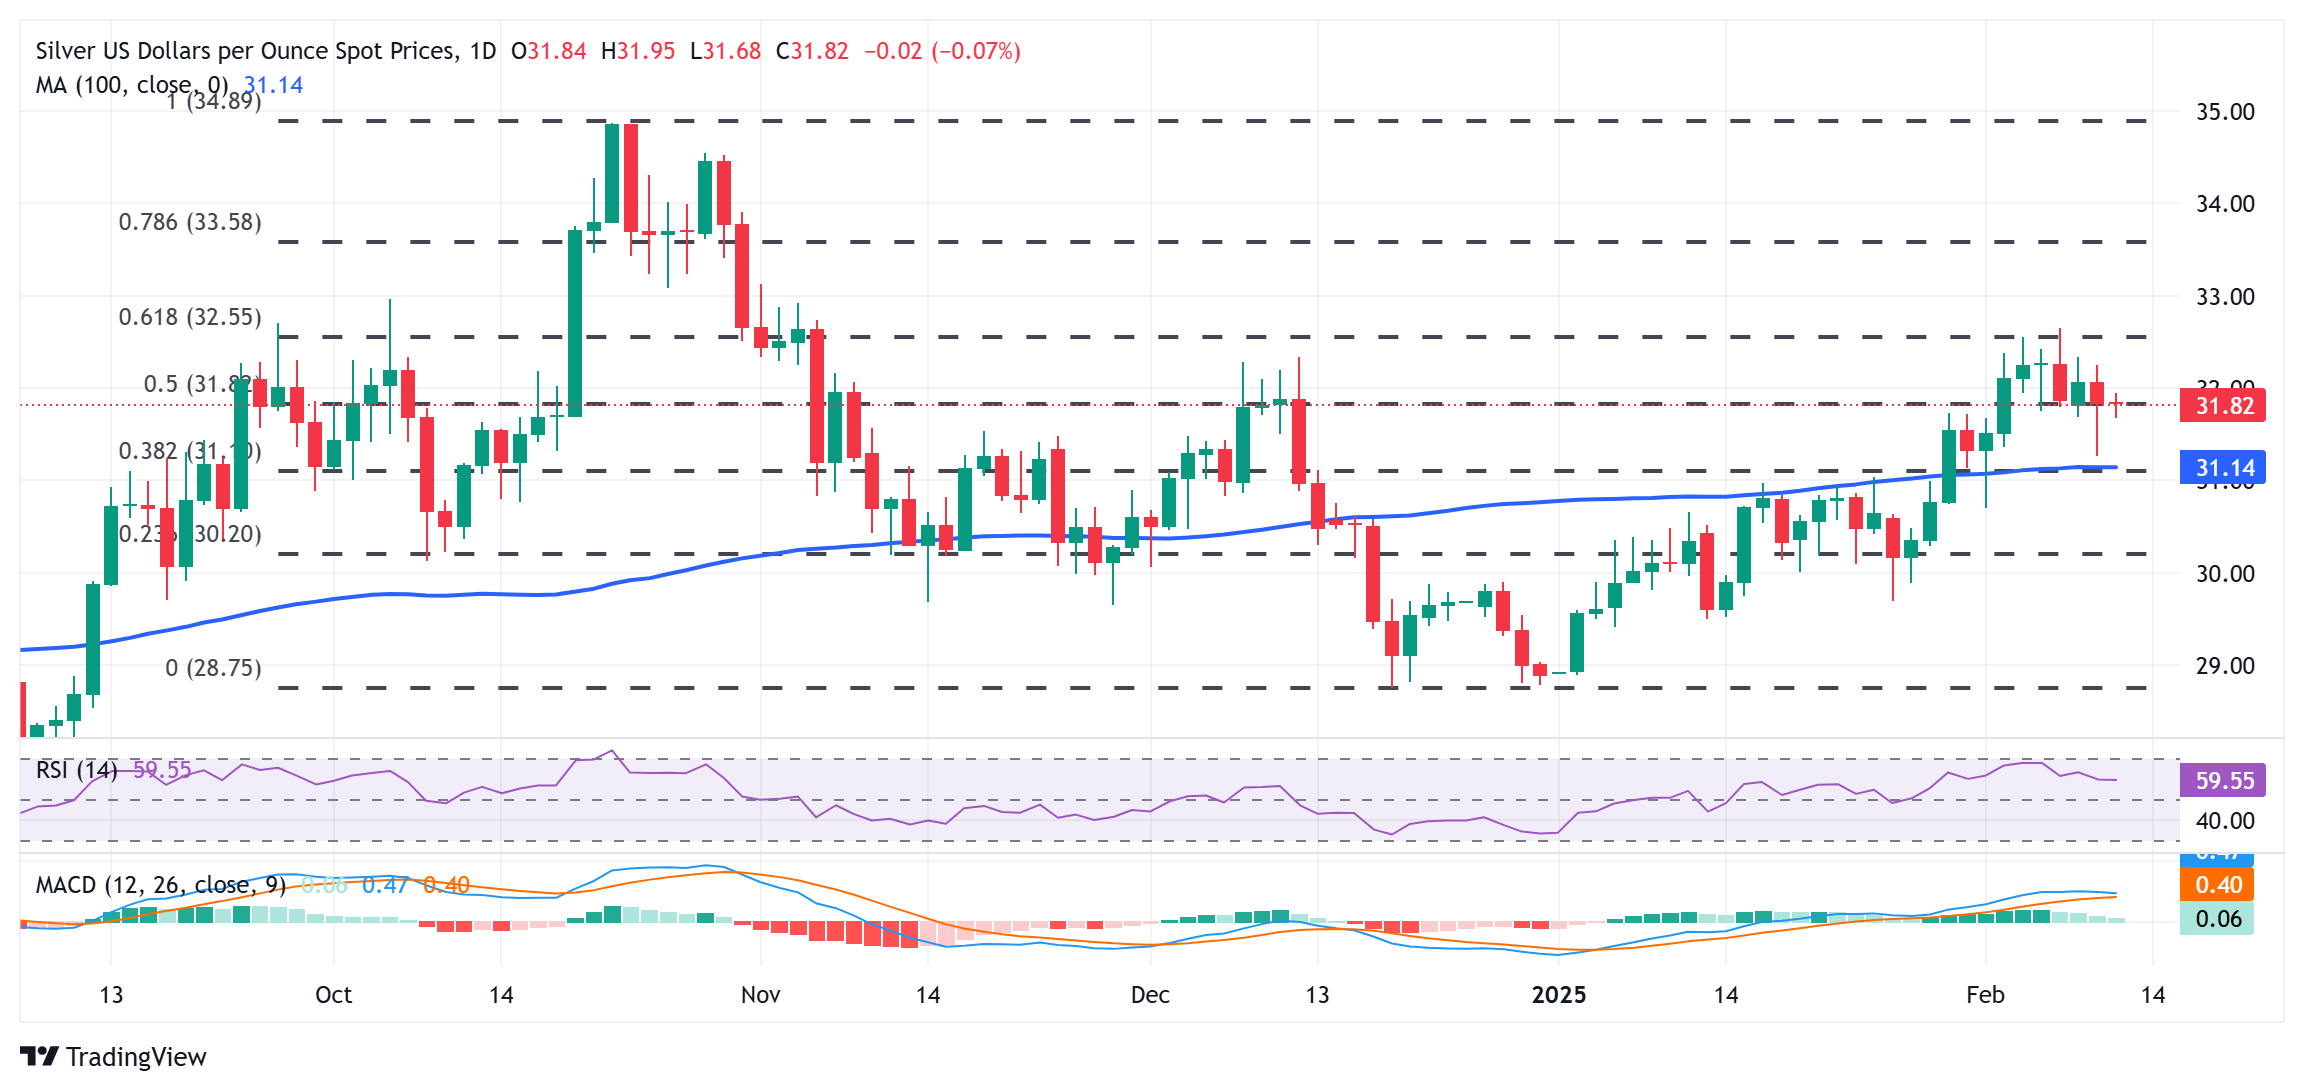
From a technical perspective, the recent breakout through the 100-day Simple Moving Average (SMA) and positive oscillators on the daily chart suggests that the path of least resistance for the XAG/USD is to the upside. That said, repeated failures to find acceptance and build on momentum beyond the $32.30 resistance warrant some caution for bullish traders. A sustained strength beyond the latter, however, will reaffirm the constructive setup and pave the way for additional near-term gains.
The XAG/USD might then aim to surpass the monthly swing high, around the $32.65 zone, which coincides with the 61.% Fibonacci retracement level of the October-December fall, and reclaim the $33.00 round figure for the first time since early November. The momentum could extend further towards the next relevant hurdle near the $33.50 area, above which the white metal could climb to the $34.00 mark en route to the $34.45 zone and the $35.00 neighborhood, or the multi-year peak touched in October.
On the flip side, the overnight swing low, around the $31.25 area, or the 100-day SMA, might continue to act as an immediate strong support for the XAG/USD. Some follow-through selling, leading to a subsequent slide below the $31.00 mark, might shift the near-term bias in favor of bearish traders and pave the way for deeper losses. Silver might then decline further towards the $30.25 region (23.6% Fibo. level) en route to the $30.00 psychological mark and the $29.55-$29.50 horizontal support.
Silver daily chart
Silver FAQs
Silver is a precious metal highly traded among investors. It has been historically used as a store of value and a medium of exchange. Although less popular than Gold, traders may turn to Silver to diversify their investment portfolio, for its intrinsic value or as a potential hedge during high-inflation periods. Investors can buy physical Silver, in coins or in bars, or trade it through vehicles such as Exchange Traded Funds, which track its price on international markets.
Silver prices can move due to a wide range of factors. Geopolitical instability or fears of a deep recession can make Silver price escalate due to its safe-haven status, although to a lesser extent than Gold's. As a yieldless asset, Silver tends to rise with lower interest rates. Its moves also depend on how the US Dollar (USD) behaves as the asset is priced in dollars (XAG/USD). A strong Dollar tends to keep the price of Silver at bay, whereas a weaker Dollar is likely to propel prices up. Other factors such as investment demand, mining supply – Silver is much more abundant than Gold – and recycling rates can also affect prices.
Silver is widely used in industry, particularly in sectors such as electronics or solar energy, as it has one of the highest electric conductivity of all metals – more than Copper and Gold. A surge in demand can increase prices, while a decline tends to lower them. Dynamics in the US, Chinese and Indian economies can also contribute to price swings: for the US and particularly China, their big industrial sectors use Silver in various processes; in India, consumers’ demand for the precious metal for jewellery also plays a key role in setting prices.
Silver prices tend to follow Gold's moves. When Gold prices rise, Silver typically follows suit, as their status as safe-haven assets is similar. The Gold/Silver ratio, which shows the number of ounces of Silver needed to equal the value of one ounce of Gold, may help to determine the relative valuation between both metals. Some investors may consider a high ratio as an indicator that Silver is undervalued, or Gold is overvalued. On the contrary, a low ratio might suggest that Gold is undervalued relative to Silver.
Author

Haresh Menghani
FXStreet
Haresh Menghani is a detail-oriented professional with 10+ years of extensive experience in analysing the global financial markets.


