|

Silver Price Analysis: XAG/USD approaches $24.00 trend line resistance

  • Silver price pares the second consecutive daily losses around the highest levels in two months.
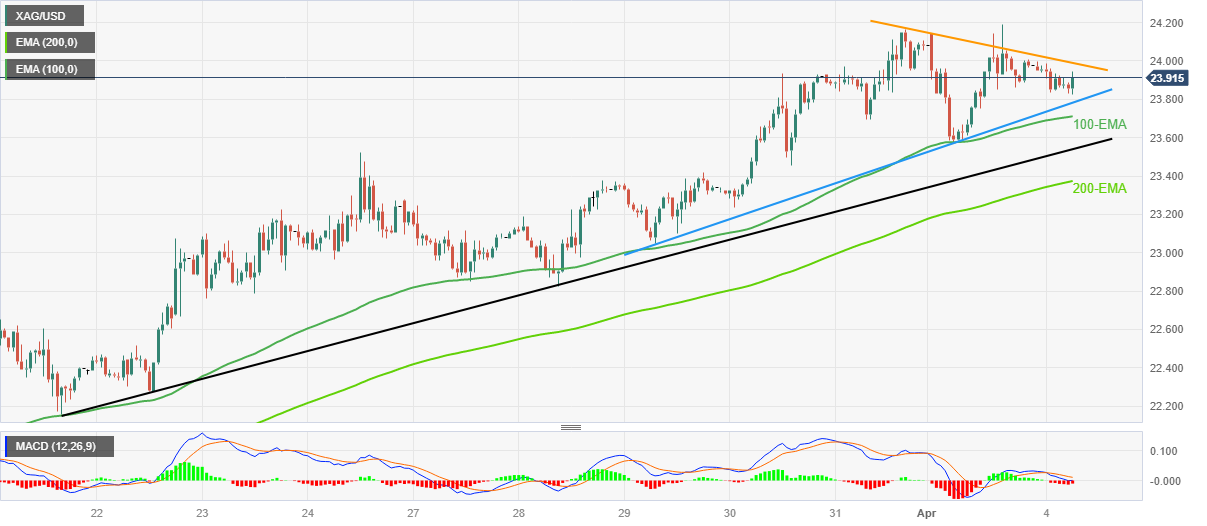
  • Descending resistance line from Friday, bearish MACD signals lure sellers.
  • Two-week-long ascending trend line, key EMAs put a floor under the XAG/USD price.

Silver price (XAG/USD) consolidates intraday losses, the second one in a row, around $23.90 as recovery moves approach the short-term key resistance lines during the early European session on Tuesday.

In doing so, the XAG/USD defends the previous day’s rebound from the 100-Exponential Moving Average (EMA), as well as a one-week-long ascending trend line.

However, a downward-sloping resistance line and bearish MACD signals are acting as immediate challenges for the Silver buyers to tackle if they wish to retake control.

Even if the quote rises past the $24.00 adjacent trend line resistance, the monthly high of $24.20 and February’s peak near $24.70 can test the XAG/USD bulls before directing them to April 2022 high near $26.25.

On the contrary, pullback moves may initially aim for the ascending support line from the last Wednesday, around $23.80 at the latest, a break that could highlight the 100-EMA level of $23.70.

Following that, ascending trend line from March 21 and the 200-EMA, respectively near $23.55 and $23.40 in that order, could challenge the Silver bears before giving them control.

Overall, Silver buyers appear to run out of steam but the bears have a long and bumpy road to travel before retaking the driver’s seat.

Silver price: Hourly chart

Trend: Limited upside expected

Additional important levels

Overview
Today last price23.94
Today Daily Change-0.04
Today Daily Change %-0.17%
Today daily open23.98
 
Trends
Daily SMA2022.31
Daily SMA5022.22
Daily SMA10022.61
Daily SMA20021.05
 
Levels
Previous Daily High24.19
Previous Daily Low23.57
Previous Weekly High24.16
Previous Weekly Low22.83
Previous Monthly High24.16
Previous Monthly Low19.9
Daily Fibonacci 38.2%23.81
Daily Fibonacci 61.8%23.96
Daily Pivot Point S123.64
Daily Pivot Point S223.3
Daily Pivot Point S323.02
Daily Pivot Point R124.25
Daily Pivot Point R224.53
Daily Pivot Point R324.87

Author

Anil Panchal

Anil Panchal

FXStreet

Anil Panchal has nearly 15 years of experience in tracking financial markets. With a keen interest in macroeconomics, Anil aptly tracks global news/updates and stays well-informed about the global financial moves and their implications.

More from Anil Panchal
Share:

Editor's Picks

AUD/USD consolidates above 0.7000/two-month low; bearish potential intact

The AUD/USD pair oscillates in a narrow range during the Asian session, and moves little following the release of mixed inflation figures from China. Spot prices currently trade around the 0.7025 region, nearly unchanged for the day, and remain within striking distance of a nearly two-month low set on Tuesday. Renewed hostilities between the US and Iran temper hopes for a deal to end the over three-month-old war.

Japanese Yen languishes despite wholesale inflation accelerates in May

USD/JPY flatlines after experiencing volatility, trading around 160.40 during the Asian hours on Wednesday. The pair continues to hold its ground, reflecting a struggling Japanese Yen that has failed to find support despite a massive acceleration in wholesale inflation. Driven by surging energy costs linked to the ongoing Middle East conflict, Japan’s Producer Price Index jumped 6.3% year-over-year in May. This hot printing comfortably outpaced April’s upwardly revised 5.3% figure and surpassed market consensus of 5.5%, marking the fastest pace of wholesale price growth in three years.

Gold languishes near March low, below $4,200 as traders await US CPI report

Gold maintains its heavily offered tone through the first half of the European session and currently trades near its lowest level since March 23, around the $4,180-$4,175 region. Renewed hostilities between the US and Iran fuel inflationary concerns and bolster bets for more hawkish central banks, driving flows away from the non-yielding yellow metal. The decline could also be attributed to technical selling following the recent breakdown below the very important 200-day SMA and seems unaffected by a softer US Dollar, which tends to benefit the commodity.

Cardano's downtrend deepens despite on-chain bottoming signals

Cardano edges lower to $0.1600 signaling a potential extension of the 30% loss from last week. The altcoin remains under intense selling pressure, weighing on its retail support. Still, a spike in dormant supply re-entering circulation signals that the selling pressure has run its course, a pattern that often precedes a rebound.

US CPI data set to show inflation at three-year high in May, backing Fed hawkish tilt

The US Bureau of Labor Statistics will publish the May Consumer Price Index (CPI) data on Wednesday. The report is expected to show another step up in consumer inflation, driven by the persistently high Oil prices due to the ongoing crisis in the Middle East.

The US economy defies the rules: 100 days into the Oil shock and the recession signal is still missing

More than three months after the start of the Iran war and the resulting disruption to global energy markets, the US economy continues to display remarkable resilience. The conflict has triggered a sharp rise in Oil prices, reignited inflationary pressures and fueled widespread concerns about a potential economic slowdown.