|

Silver Price Analysis: XAG/USD consolidates in a range around $25.00, below multi-month peak

  • Silver oscillates in a range for the second successive day on Thursday.
  • A slightly overbought RSI is holding back bulls from placing fresh bets.
  • The technical setup supports prospects for a further appreciating move.

Silver (XAG/USD) continues with its struggle to find acceptance above the $25.00 psychological mark and seesaws between tepid gains/minor losses for the second successive day on Thursday. The white metal extends its sideways consolidative price move through the first half of the European session as traders look forward to the US PCE Price Index for some meaningful impetus.

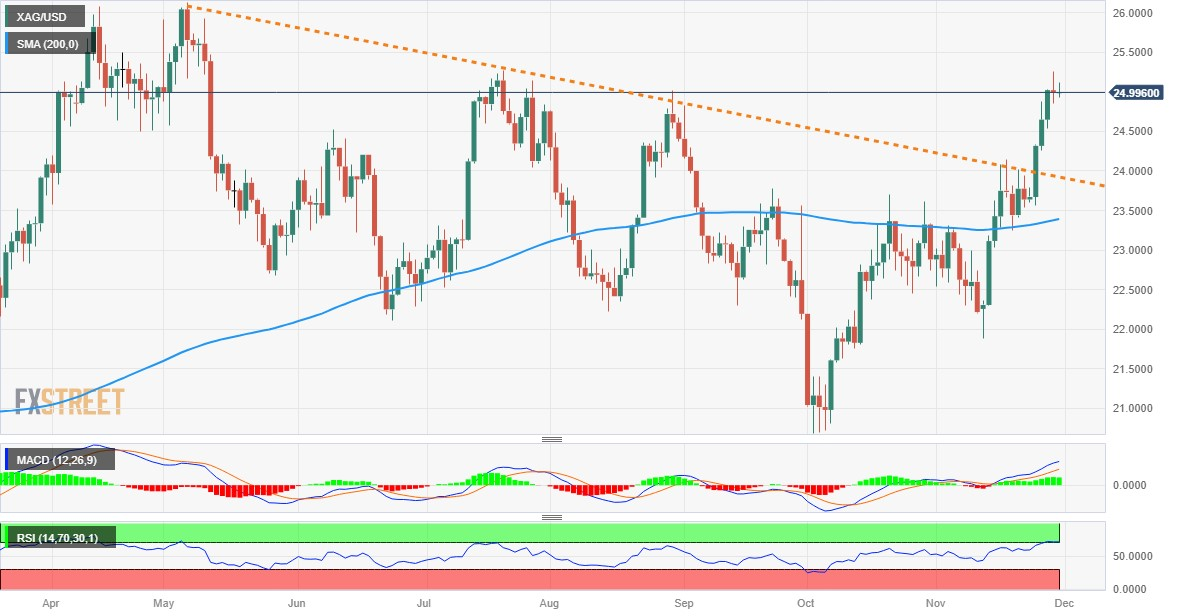
From a technical perspective, the Relative Strength Index (RSI) on the daily chart is flashing slightly overbought conditions and holding back bulls from placing fresh bets. That said, the recent sustained move beyond the very important 200-day Simple Moving Average (SMA) and a subsequent breakout through a multi-month-old descending trend-line suggests that the path of least resistance for the XAG/USD is to the upside. However, it will still be prudent to wait for some near-term consolidation or a modest pullback before positioning for an extension of a well-established uptrend witnessed over the past three weeks or so.

In the meantime, the $24.75-$24.70 region is likely to protect the immediate downside. Any further corrective slide is likely to attract fresh buyers near the $24.20-$24.15 zone. This should help limit the downside for the XAG/USD near the aforementioned descending trend-line resistance breakpoint, around the $24.00 mark. The latter should act as a key pivotal point, which if broken decisively might prompt some technical selling and pave the way for deeper losses, towards retesting the 200-day SMA, near the $23.40-$23.35 area.

On the flip side, the $25.25 region, or over a four-month high touched on Wednesday, could offer some resistance. Some follow-through buying will be seen as a fresh trigger for bullish traders and lift the XAG/USD towards the next relevant hurdle near the $25.55-$25.60 zone. The momentum could get extended further and allow the white metal to reclaim the $26.00 mark and test the YTD peak, around the $26.15 region touched in May.

Silver daily chart

fxsoriginal

Technical levels to watch

XAG/USD

Overview
Today last price24.98
Today Daily Change-0.01
Today Daily Change %-0.04
Today daily open24.99
 
Trends
Daily SMA2023.44
Daily SMA5022.87
Daily SMA10023.3
Daily SMA20023.38
 
Levels
Previous Daily High25.26
Previous Daily Low24.85
Previous Weekly High24.33
Previous Weekly Low23.25
Previous Monthly High23.7
Previous Monthly Low20.68
Daily Fibonacci 38.2%25.01
Daily Fibonacci 61.8%25.1
Daily Pivot Point S124.81
Daily Pivot Point S224.62
Daily Pivot Point S324.39
Daily Pivot Point R125.22
Daily Pivot Point R225.45
Daily Pivot Point R325.64

Author

Haresh Menghani

Haresh Menghani is a detail-oriented professional with 10+ years of extensive experience in analysing the global financial markets.

More from Haresh Menghani
Share:

Markets move fast. We move first.

Orange Juice Newsletter brings you expert driven insights - not headlines. Every day on your inbox.

By subscribing you agree to our Terms and conditions.

Editor's Picks

EUR/USD climbs toward 1.1800 on broad USD weakness

EUR/USD gathers bullish momentum and advances toward 1.1800 in the second half of the day on Tuesday. The US Dollar weakens and helps the pair stretch higher after the employment report showed that Nonfarm Payrolls declined by 105,000 in October before rising by 64,000 in November.

GBP/USD climbs to fresh two-month high above 1.3400

GBP/USD gains traction in the American session and trades at its highest level since mid-October above 1.3430. The British Pound benefits from upbeat PMI data, while the US Dollar struggles to find demand following the mixed employment figures and weaker-than-forecast PMI prints, allowing the pair to march north.

Gold extends its consolidative phase around $4,300

Gold trades in positive above $4,300 after spending the first half of the day under bearish pressure. XAU/USD capitalizes on renewed USD weakness after the jobs report showed that the Unemployment Rate climbed to 4.6% in November and the PMI data revealed a loss of growth momentum in the private sector in December. 

US Retail Sales virtually unchanged at $732.6 billion in October

Retail Sales in the United States were virtually unchanged at $732.6 billion in October, the US Census Bureau reported on Tuesday. This print followed the 0.1% increase (revised from 0.3%) recorded in September and came in below the market expectation of +0.1%.

Ukraine-Russia in the spotlight once again

Since the start of the week, gold’s price has moved lower, but has yet to erase the gains made last week. In today’s report we intend to focus on the newest round of peace talks between Russia and Ukraine, whilst noting the release of the US Employment data later on day and end our report with an update in regards to the tensions brewing in Venezuela.

BNB Price Forecast: BNB slips below $855 as bearish on-chain signals and momentum indicators turn negative

BNB, formerly known as Binance Coin, continues to trade down around $855 at the time of writing on Tuesday, after a slight decline the previous day. Bearish sentiment further strengthens as BNB’s on-chain and derivatives data show rising retail activity.