Silver Price Analysis: 50-HMA at $26.53 remains a tough nut to crack
- Silver bulls continue to face rejection at 50-HMA.
- Hourly RSI turns bearish, suggesting more downside.
- $26.05 could continue to limit the declines in XAG/USD.

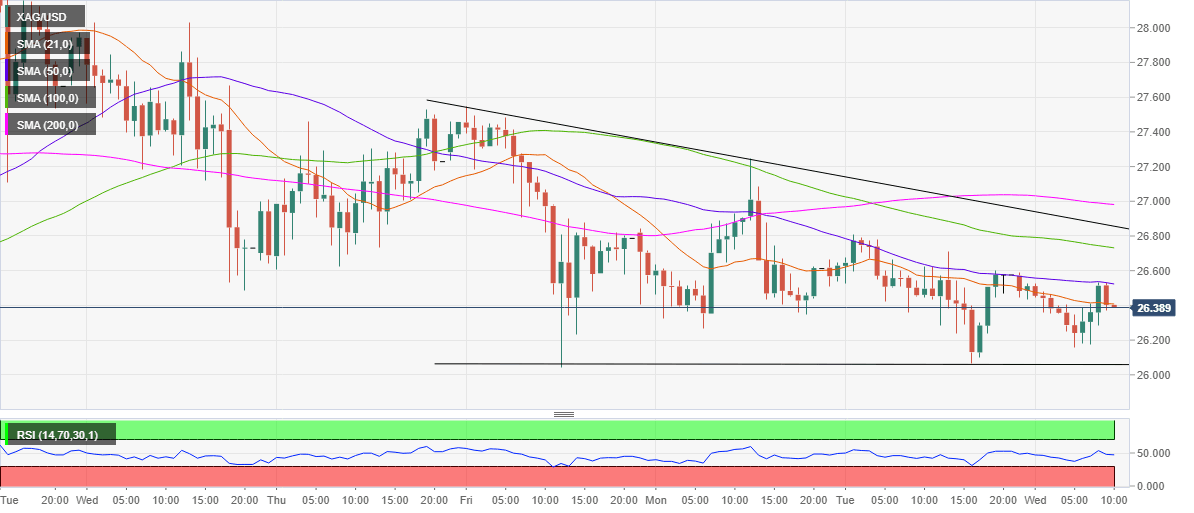
Silver (XAG/USD) extends its bearish consolidation phase into a fourth straight session on Wednesday, carving out a descending triangle on the hourly chart.
So far this week, the price has formed lower highs, with the upside attempts capped by the bearish 50-hourly Simple Moving Average (HMA), currently at $26.53.
Meanwhile, the buyers continue to find support near $26.05, August 21 and 25 lows.
The hourly Relative Strength Index (RSI) has turned south and cracked the midline, into the bearish region at 47.45.
Therefore, the sellers aim for the daily low of $26.24 should the 21-HMA support at $26.41 give way. Further down, the aforesaid critical support at $26.05 will come into play.
To the top side, a clearance of the 50-HMA barrier is needed to negate the near-term bearish bias.
The 100-HMA hurdle at $26.73 will lure the buyers, as they look to regain the $27 mark, where the horizontal 200-HMA meets.
XAG/USD: Hourly chart
XAG/USD: Additional levels
Author

Dhwani Mehta
FXStreet
Residing in Mumbai (India), Dhwani is a Senior Analyst and Manager of the Asian session at FXStreet. She has over 10 years of experience in analyzing and covering the global financial markets, with specialization in Forex and commodities markets.


