Silver Miners (SIL) still finding bottom [Video]
![Silver Miners (SIL) still finding bottom [Video]](https://editorial.fxstreet.com/images/Markets/Commodities/Metals/Silver/sterling-silver-46984604_XtraLarge.jpg)
The silver miners ETF (SIL) is an exchange-traded fund that seeks to track the performance of companies primarily engaged in silver mining. By investing in SIL, investors gain exposure to a diversified portfolio of silver mining companies, offering potential benefits of capital appreciation and portfolio diversification within the precious metals sector. In this article, we will look at the Elliott Wave outlook for this ETF.
Silver Miners ETF monthly Elliott Wave chart
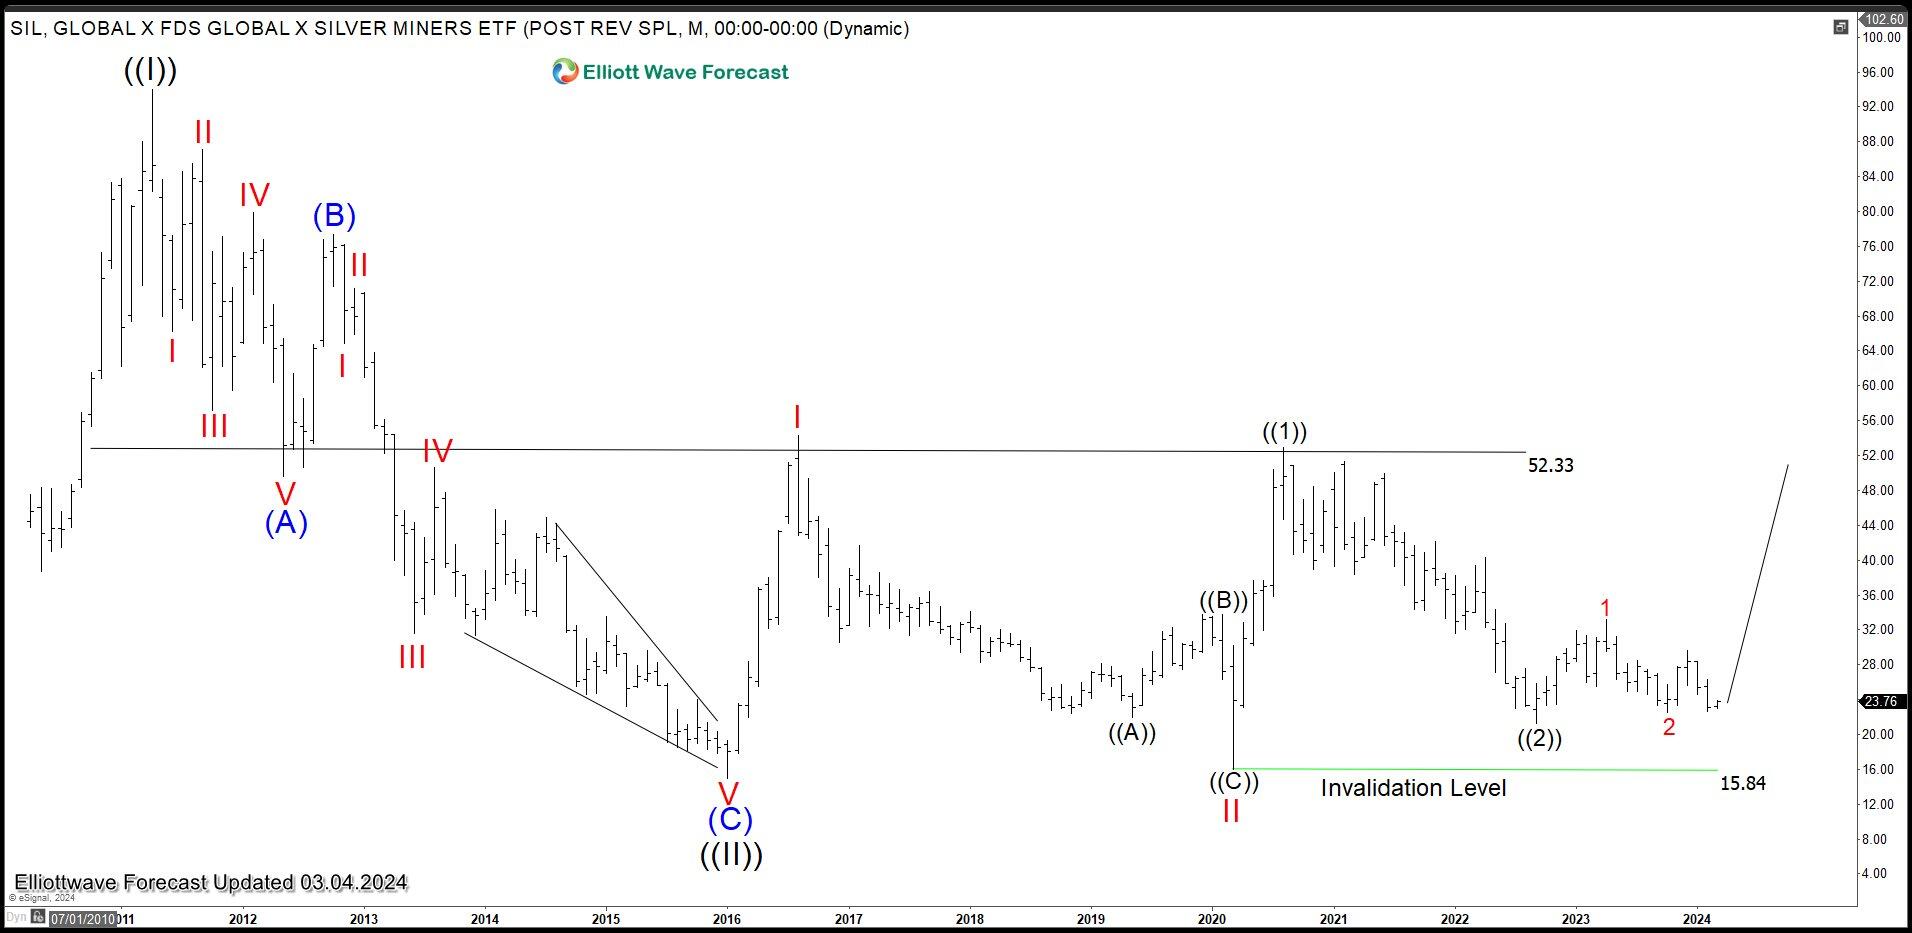
Monthly Elliott Wave chart of SIL above shows that the ETF ended all-time correction wave ((II)) at 14.94 in 2016. Up from there, the ETF rallied in a nest I-II-((1))-((2)). Wave I ended at 54.34 and wave II ended at 15.84. It then extended higher in wave ((1)) to 52.87 and pullback in wave ((2)) ended at 21.26. As far as SIL stays above 15.84, expect the ETF to extend higher again.
Silver Miners ETF daily Elliott Wave chart
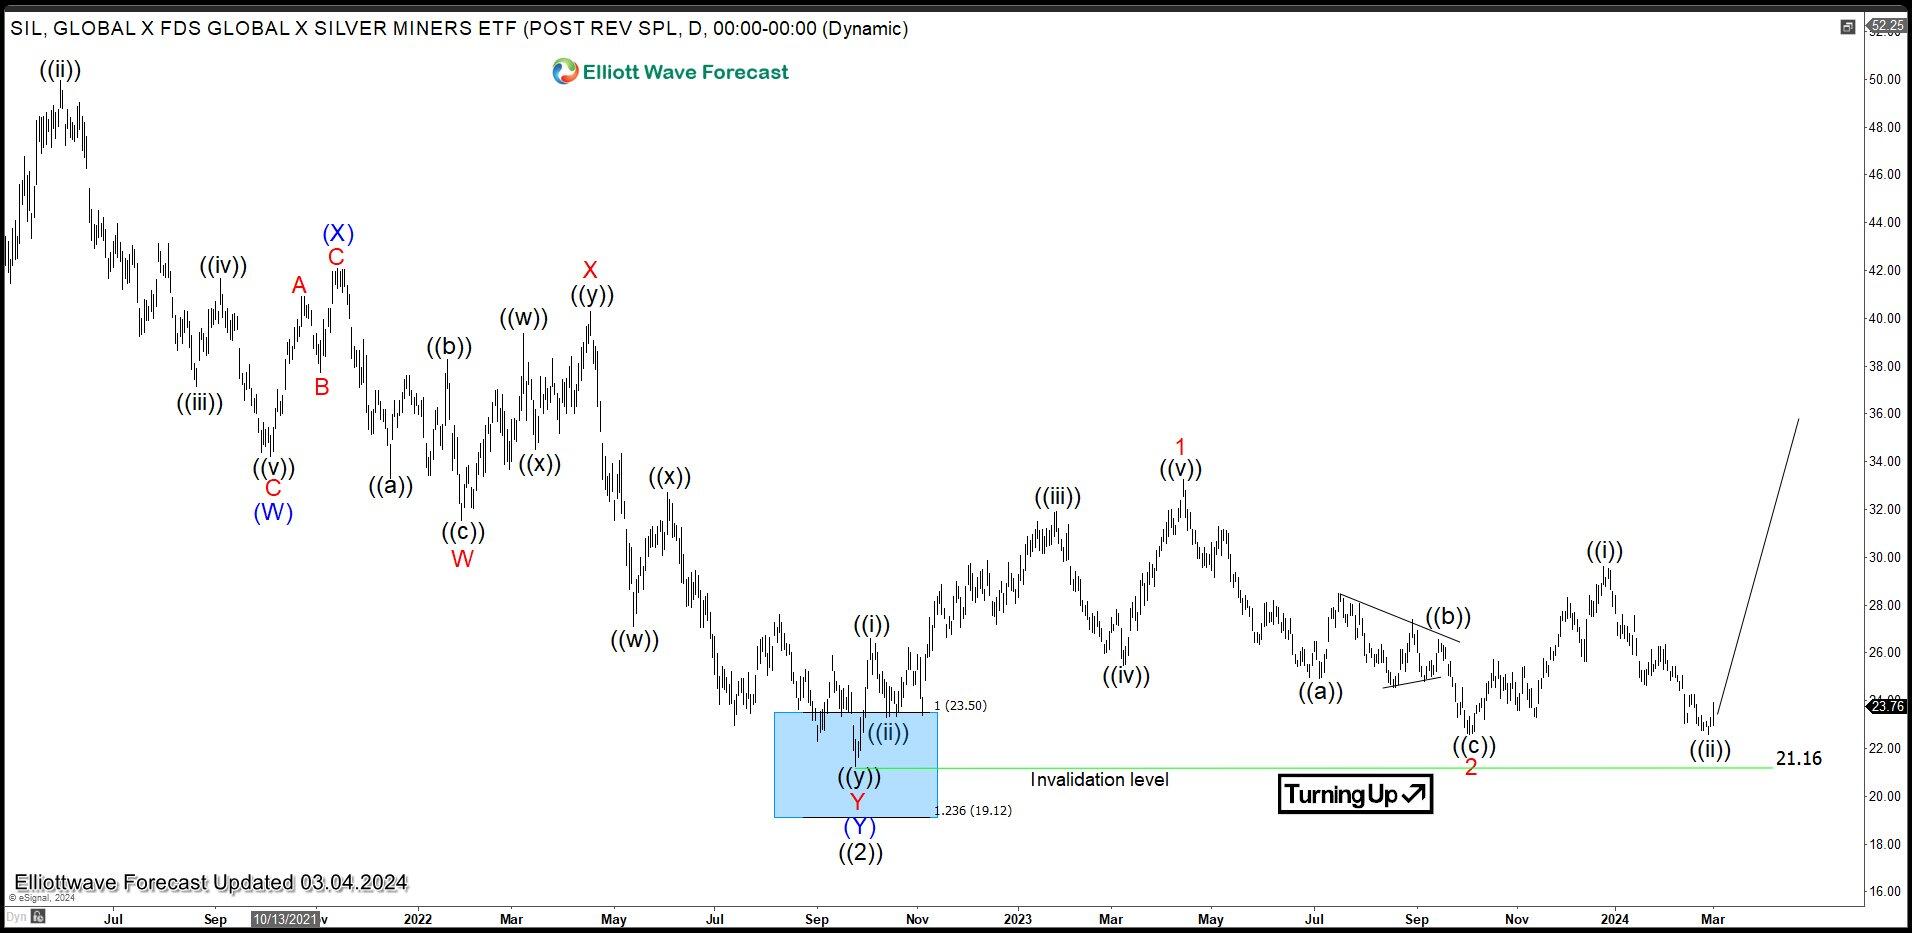
Daily Elliott Wave chart of Silver Miners (SIL) above shows that the ETF still trying to find the bottom. Pullback to 21.16 is proposed to complete wave ((2)). From there, the instrument rallied in 5 waves diagonal. Up from wave ((2)), wave 1 ended at 33.24 and pullback in wave 2 ended at 22.57. Internal subdivision of wave 2 unfolded in a zigzag structure. Down from wave 1, wave ((a)) ended at 24.91 and wave ((b)) ended at 26.55. Wave ((c)) lower ended at 22.57 which completed wave 2. The instrument then turned higher. Up from wave 2, wave ((i)) ended at 29.61 and pullback in wave ((ii)) ended at 22.58. As far as pivot at 21.16 low stays intact, expect the ETF to extend higher.
Silver Miners ETF (SIL) Elliott Wave [Video]
Author

Elliott Wave Forecast Team
ElliottWave-Forecast.com


